Comcast 2013 Annual Report Download - page 114
Download and view the complete annual report
Please find page 114 of the 2013 Comcast annual report below. You can navigate through the pages in the report by either clicking on the pages listed below, or by using the keyword search tool below to find specific information within the annual report.-
 1
1 -
2
-
3
-
4
-
5
-
6
-
7
-
8
-
9
-
10
-
11
-
12
-
13
-
14
-
15
-
16
-
17
-
18
-
19
-
20
-
21
-
22
-
23
-
24
-
25
-
26
-
27
-
28
-
29
-
30
-
31
-
32
-
33
-
34
-
35
-
36
-
37
-
38
-
39
-
40
-
41
-
42
-
43
-
44
-
45
-
46
-
47
-
48
-
49
-
50
-
51
-
52
-
53
-
54
-
55
-
56
-
57
-
58
-
59
-
60
-
61
-
62
-
63
-
64
-
65
-
66
-
67
-
68
-
69
-
70
-
71
-
72
-
73
-
74
-
75
-
76
-
77
-
78
-
79
-
80
-
81
-
82
-
83
-
84
-
85
-
86
-
87
-
88
-
89
-
90
-
91
-
92
-
93
-
94
-
95
-
96
-
97
-
98
-
99
-
100
-
101
-
102
-
103
-
 104
104 -
 105
105 -
 106
106 -
 107
107 -
 108
108 -
 109
109 -
 110
110 -
 111
111 -
 112
112 -
 113
113 -
 114
114 -
 115
115 -
 116
116 -
 117
117 -
 118
118 -
 119
119 -
 120
120 -
 121
121 -
 122
122 -
 123
123 -
 124
124 -
125
-
126
-
127
-
128
-
129
-
130
-
131
-
132
-
133
-
134
-
135
-
136
-
137
-
138
-
139
-
140
-
141
-
142
-
143
-
144
-
145
-
146
-
147
-
148
-
149
-
150
-
151
-
152
-
153
-
154
-
155
-
156
-
157
-
158
-
159
-
160
-
161
-
162
-
163
-
164
-
165
-
166
-
167
-
168
-
169
-
170
-
171
-
172
-
173
-
174
-
175
-
176
-
177
-
178
-
179
-
180
-
181
-
182
-
183
-
184
-
185
-
186
-
187
-
188
-
189
-
190
-
191
-
192
-
193
-
194
-
195
-
196
-
197
-
198
-
199
-
200
-
201
-
202
-
203
-
204
-
205
-
206
-
207
-
208
-
209
-
210
-
211
-
212
-
213
-
214
-
215
-
216
-
217
-
218
-
219
-
220
-
221
-
222
-
223
-
224
-
225
-
226
-
227
-
228
-
229
-
230
-
231
-
232
-
233
-
234
-
235
-
236
-
237
-
238
-
239
-
240
-
241
-
242
-
243
-
244
-
245
-
246
-
247
-
248
-
249
-
250
-
251
-
252
-
253
-
254
-
255
-
256
-
257
-
258
-
259
-
260
-
261
-
262
-
263
-
264
-
265
-
266
-
267
-
268
-
269
-
270
-
271
-
272
-
273
-
274
-
275
-
276
-
277
-
278
-
279
-
280
-
281
-
282
-
283
-
284
-
285
-
286
-
287
-
288
-
289
-
290
-
291
-
292
-
293
-
294
-
295
-
296
-
297
-
298
-
299
-
300
-
301
-
302
-
303
-
304
-
305
-
306
-
307
-
308
-
309
-
310
-
311
-
312
-
313
-
314
-
315
-
316
-
317
-
318
-
319
-
320
-
321
-
322
-
323
-
324
-
325
-
326
-
327
-
328
-
329
-
330
-
331
-
332
-
333
-
334
-
335
 |
 |

Table of Contents
Comcast Corporation
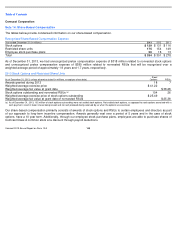
The cost associated with our share-based compensation is based on an award’
s estimated fair value at the date of grant and is
recognized over the period in which any related services are provided. We use the Black-
Scholes option pricing model to estimate
the fair value of stock option awards. RSUs are valued based on the closing price of our Class A common stock on the date of grant
and are discounted for the lack of dividends, if any, during the vesting period. The table below presents the weighted-
average fair
value on the date of grant of RSUs and Class A common stock options awarded under our various plans and the related weighted-
average valuation assumptions.
Note 15: Income Taxes
Components of Income Tax Expense
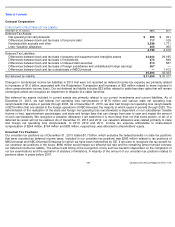
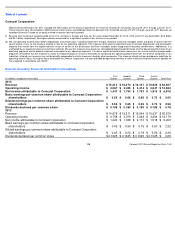
Our income tax expense differs from the federal statutory amount because of the effect of the items detailed in the table below.
Year Ended December 31
2013
2012
2011
RSUs fair value
$
38.28
$
27.80
$
22.78
Stock options fair value
$
8.80
$
7.38
$
6.96
Stock Option Valuation Assumptions:
Dividend yield
1.9
%
2.2
%
1.8
%
Expected volatility
25.0
%
29.0
%
28.1
%
Risk-free interest rate
1.3
%
1.7
%
2.8
%
Expected option life (in years)
7.0
7.0
7.0
Year ended December 31 (in millions)
2013
2012
2011
Current expense (benefit):
Federal
$
3,183
$
3,004
$
1,480
State
581
432
359
Foreign
200
169
153
3,964
3,605
1,992
Deferred expense (benefit):
Federal
(76
)
160
658
State
108
(40
)
371
Foreign
(16
)
19
29
16
139
1,058
Income tax expense
$
3,980
$
3,744
$
3,050
Year ended December 31 (in millions)
2013
2012
2011
Federal tax at statutory rate
$
3,890
$
4,063
$
2,872
State income taxes, net of federal benefit
319
178
354
Foreign income taxes, net of federal credit
15
92
89
Nontaxable income attributable to noncontrolling interests
(103
)
(620
)
(410
)
Adjustments to uncertain and effectively settled tax positions, net
58
114
77
Accrued interest on uncertain and effectively settled tax positions, net
114
23
66
Other
(313
)
(106
)
2
Income tax expense
$
3,980
$
3,744
$
3,050
109
Comcast 2013 Annual Report on Form 10-
K