Comcast 2013 Annual Report Download - page 73
Download and view the complete annual report
Please find page 73 of the 2013 Comcast annual report below. You can navigate through the pages in the report by either clicking on the pages listed below, or by using the keyword search tool below to find specific information within the annual report.-
 1
1 -
2
-
3
-
4
-
5
-
6
-
7
-
8
-
9
-
10
-
11
-
12
-
13
-
14
-
15
-
16
-
17
-
18
-
19
-
20
-
21
-
22
-
23
-
24
-
25
-
26
-
27
-
28
-
29
-
30
-
31
-
32
-
33
-
34
-
35
-
36
-
37
-
38
-
39
-
40
-
41
-
42
-
43
-
44
-
45
-
46
-
47
-
48
-
49
-
50
-
51
-
52
-
53
-
54
-
55
-
56
-
57
-
58
-
59
-
60
-
61
-
62
-
 63
63 -
 64
64 -
 65
65 -
 66
66 -
 67
67 -
 68
68 -
 69
69 -
 70
70 -
 71
71 -
 72
72 -
 73
73 -
 74
74 -
 75
75 -
 76
76 -
 77
77 -
 78
78 -
 79
79 -
 80
80 -
 81
81 -
 82
82 -
 83
83 -
84
-
85
-
86
-
87
-
88
-
89
-
90
-
91
-
92
-
93
-
94
-
95
-
96
-
97
-
98
-
99
-
100
-
101
-
102
-
103
-
104
-
105
-
106
-
107
-
108
-
109
-
110
-
111
-
112
-
113
-
114
-
115
-
116
-
117
-
118
-
119
-
120
-
121
-
122
-
123
-
124
-
125
-
126
-
127
-
128
-
129
-
130
-
131
-
132
-
133
-
134
-
135
-
136
-
137
-
138
-
139
-
140
-
141
-
142
-
143
-
144
-
145
-
146
-
147
-
148
-
149
-
150
-
151
-
152
-
153
-
154
-
155
-
156
-
157
-
158
-
159
-
160
-
161
-
162
-
163
-
164
-
165
-
166
-
167
-
168
-
169
-
170
-
171
-
172
-
173
-
174
-
175
-
176
-
177
-
178
-
179
-
180
-
181
-
182
-
183
-
184
-
185
-
186
-
187
-
188
-
189
-
190
-
191
-
192
-
193
-
194
-
195
-
196
-
197
-
198
-
199
-
200
-
201
-
202
-
203
-
204
-
205
-
206
-
207
-
208
-
209
-
210
-
211
-
212
-
213
-
214
-
215
-
216
-
217
-
218
-
219
-
220
-
221
-
222
-
223
-
224
-
225
-
226
-
227
-
228
-
229
-
230
-
231
-
232
-
233
-
234
-
235
-
236
-
237
-
238
-
239
-
240
-
241
-
242
-
243
-
244
-
245
-
246
-
247
-
248
-
249
-
250
-
251
-
252
-
253
-
254
-
255
-
256
-
257
-
258
-
259
-
260
-
261
-
262
-
263
-
264
-
265
-
266
-
267
-
268
-
269
-
270
-
271
-
272
-
273
-
274
-
275
-
276
-
277
-
278
-
279
-
280
-
281
-
282
-
283
-
284
-
285
-
286
-
287
-
288
-
289
-
290
-
291
-
292
-
293
-
294
-
295
-
296
-
297
-
298
-
299
-
300
-
301
-
302
-
303
-
304
-
305
-
306
-
307
-
308
-
309
-
310
-
311
-
312
-
313
-
314
-
315
-
316
-
317
-
318
-
319
-
320
-
321
-
322
-
323
-
324
-
325
-
326
-
327
-
328
-
329
-
330
-
331
-
332
-
333
-
334
-
335
 |
 |

Table of Contents
Investing Activities
Net cash used in investing activities in 2013 consisted primarily of cash paid for capital expenditures, acquisitions of real estate
properties, purchases of investments and cash paid for intangible assets. Net cash used in investing activities in 2012 consisted
primarily of cash paid for capital expenditures, cash paid for intangible assets and the purchase of investments and was
substantially offset by proceeds from sales of businesses and investments and return of capital from investees.
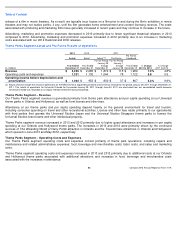
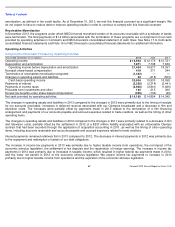
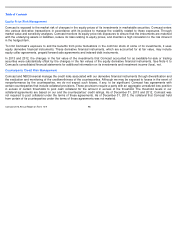
Capital Expenditures
Our most significant recurring investing activity has been capital expenditures in our Cable Communications segment, and we
expect that this will continue in the future. The table below summarizes the capital expenditures we incurred in our Cable
Communications segment in 2013, 2012 and 2011.
Cable Communications capital expenditures increased in 2013 and 2012 primarily due to an increase in customer premise
equipment purchases, including purchases related to our X1 platform and our wireless gateways in 2013, and increased investment
in business services and network capacity.
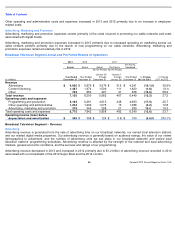
Capital expenditures in our NBCUniversal segments increased 52.0% to $1.2 billion in 2013 primarily due to continued investment
at our Universal theme parks. Capital expenditures in our NBCUniversal segments increased 75.7% to $763 million in 2012
primarily due to increased investment at our Universal theme parks and increased investment in technical infrastructure to support
our cable networks and broadcast television operations.
The rate of growth of our capital expenditures for 2014 is expected to increase as we continue to invest significantly in the
deployment of our X1 platform and wireless gateways to our customers and the expansion of business services and our home
security and automation services. Capital expenditures for subsequent years will depend on numerous factors, including
acquisitions, competition, changes in technology, regulatory changes, and the timing and rate of deployment of new services and
capacity for existing services. In addition, we have invested and expect to continue to invest in existing and new attractions at our
Universal theme parks.
Cash Paid for Intangible Assets
In 2013 and 2012, cash paid for intangible assets consisted primarily of software.
Acquisitions of Real Estate Properties
In 2013, acquisitions of real estate properties included NBCUniversal’
s purchases of the 30 Rockefeller Plaza properties it occupies
in connection with the Redemption Transaction, NBCUniversal’
s purchase of the property located at 10 Universal City Plaza, which
is adjacent to Universal Studios in Hollywood, California and our purchase of an 80% interest in a business whose primary asset is
our corporate headquarters located in Philadelphia, Pennsylvania.
Year ended December 31 (in millions)
2013
2012
2011
Cable distribution system
$
1,819
$
1,720
$
1,715
Customer premise equipment
2,990
2,678
2,594
Other equipment
527
462
420
Buildings and building improvements
67
57
77
Land
—
4
—
Total
$
5,403
$
4,921
$
4,806
Comcast 2013 Annual Report on Form 10
-
K
68