Comcast 2013 Annual Report Download - page 173
Download and view the complete annual report
Please find page 173 of the 2013 Comcast annual report below. You can navigate through the pages in the report by either clicking on the pages listed below, or by using the keyword search tool below to find specific information within the annual report.-
 1
1 -
2
-
3
-
4
-
5
-
6
-
7
-
8
-
9
-
10
-
11
-
12
-
13
-
14
-
15
-
16
-
17
-
18
-
19
-
20
-
21
-
22
-
23
-
24
-
25
-
26
-
27
-
28
-
29
-
30
-
31
-
32
-
33
-
34
-
35
-
36
-
37
-
38
-
39
-
40
-
41
-
42
-
43
-
44
-
45
-
46
-
47
-
48
-
49
-
50
-
51
-
52
-
53
-
54
-
55
-
56
-
57
-
58
-
59
-
60
-
61
-
62
-
63
-
64
-
65
-
66
-
67
-
68
-
69
-
70
-
71
-
72
-
73
-
74
-
75
-
76
-
77
-
78
-
79
-
80
-
81
-
82
-
83
-
84
-
85
-
86
-
87
-
88
-
89
-
90
-
91
-
92
-
93
-
94
-
95
-
96
-
97
-
98
-
99
-
100
-
101
-
102
-
103
-
104
-
105
-
106
-
107
-
108
-
109
-
110
-
111
-
112
-
113
-
114
-
115
-
116
-
117
-
118
-
119
-
120
-
121
-
122
-
123
-
124
-
125
-
126
-
127
-
128
-
129
-
130
-
131
-
132
-
133
-
134
-
135
-
136
-
137
-
138
-
139
-
140
-
141
-
142
-
143
-
144
-
145
-
146
-
147
-
148
-
149
-
150
-
151
-
152
-
153
-
154
-
155
-
156
-
157
-
158
-
159
-
160
-
161
-
162
-
 163
163 -
 164
164 -
 165
165 -
 166
166 -
 167
167 -
 168
168 -
 169
169 -
 170
170 -
 171
171 -
 172
172 -
 173
173 -
 174
174 -
 175
175 -
 176
176 -
 177
177 -
 178
178 -
 179
179 -
 180
180 -
 181
181 -
 182
182 -
 183
183 -
184
-
185
-
186
-
187
-
188
-
189
-
190
-
191
-
192
-
193
-
194
-
195
-
196
-
197
-
198
-
199
-
200
-
201
-
202
-
203
-
204
-
205
-
206
-
207
-
208
-
209
-
210
-
211
-
212
-
213
-
214
-
215
-
216
-
217
-
218
-
219
-
220
-
221
-
222
-
223
-
224
-
225
-
226
-
227
-
228
-
229
-
230
-
231
-
232
-
233
-
234
-
235
-
236
-
237
-
238
-
239
-
240
-
241
-
242
-
243
-
244
-
245
-
246
-
247
-
248
-
249
-
250
-
251
-
252
-
253
-
254
-
255
-
256
-
257
-
258
-
259
-
260
-
261
-
262
-
263
-
264
-
265
-
266
-
267
-
268
-
269
-
270
-
271
-
272
-
273
-
274
-
275
-
276
-
277
-
278
-
279
-
280
-
281
-
282
-
283
-
284
-
285
-
286
-
287
-
288
-
289
-
290
-
291
-
292
-
293
-
294
-
295
-
296
-
297
-
298
-
299
-
300
-
301
-
302
-
303
-
304
-
305
-
306
-
307
-
308
-
309
-
310
-
311
-
312
-
313
-
314
-
315
-
316
-
317
-
318
-
319
-
320
-
321
-
322
-
323
-
324
-
325
-
326
-
327
-
328
-
329
-
330
-
331
-
332
-
333
-
334
-
335
 |
 |

Table of Contents
NBCUniversal Media, LLC
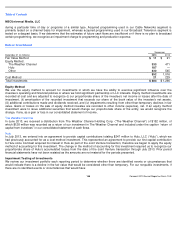
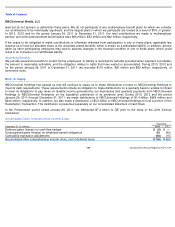
Note 13: Share-Based Compensation
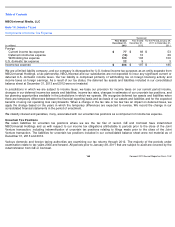
The tables below provide condensed information on our share-based compensation.
Recognized Share-Based Compensation Expense
As of December 31, 2013, we had unrecognized pretax compensation expense of $35 million related to nonvested Comcast stock
options and unrecognized pretax compensation expense of $98 million related to nonvested Comcast restricted share units
(“RSUs”) that will be recognized over a weighted-average period of approximately 2.2 years and 1.7 years, respectively.
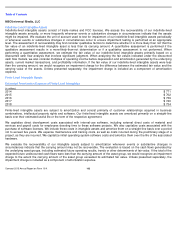
Comcast maintains share-
based compensation plans that primarily consist of awards of stock options and RSUs to certain
employees and directors as part of its approach to long-
term incentive compensation. Awards generally vest over a period of 5
years and in the case of stock options, have a 10 year term. Additionally, through the employee stock purchase plans, employees
are able to purchase shares of Comcast Class A common stock at a discount through payroll deductions. Certain of our employees
participate in these plans and the expense associated with their participation is settled in cash with Comcast.
The cost associated with Comcast’s share-based compensation is based on an award’
s estimated fair value at the date of grant
and is recognized over the period in which any related services are provided. Comcast uses the Black-
Scholes option pricing model
to estimate the fair value of stock option awards. RSUs are valued based on the closing price of Comcast Class A common stock
on the date of grant and are discounted for the lack of dividends, if any, during the vesting period. The table below presents the
weighted
-average fair value on the date of grant of RSUs and Class A common stock options awarded under Comcast’
s various
plans to employees of NBCUniversal and the related weighted-average valuation assumptions.
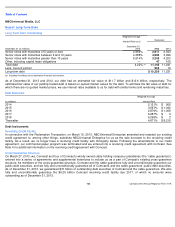
Successor
(in millions)
Year Ended
December 31,
2013
Year Ended
December 31,
2012
For the Period January 29,
2011 to December 31,
2011
Stock options
$
15
$
15
$
13
Restricted share units
42
28
18
Employee stock purchase plans
5
4
2
Total
$
62
$
47
$
33
Successor
Year Ended
December 31,
2013
Year Ended
December 31,
2012
For the Period January 29,
2011 to December 31,
2011
RSUs fair value
$
37.79
$
27.51
$
21.75
Stock options fair value
$
8.86
$
7.42
$
6.77
Stock Option Valuation Assumptions:
Dividend yield
1.9
%
2.2
%
1.8
%
Expected volatility
25.2
%
29.0
%
28.5
%
Risk
-
free interest rate
1.3
%
1.7
%
2.6
%
Expected option life (in years)
7.0
7.0
7.0
Comcast 2013 Annual Report on Form 10
-
K
168