Comcast 2013 Annual Report Download - page 155
Download and view the complete annual report
Please find page 155 of the 2013 Comcast annual report below. You can navigate through the pages in the report by either clicking on the pages listed below, or by using the keyword search tool below to find specific information within the annual report.-
 1
1 -
2
-
3
-
4
-
5
-
6
-
7
-
8
-
9
-
10
-
11
-
12
-
13
-
14
-
15
-
16
-
17
-
18
-
19
-
20
-
21
-
22
-
23
-
24
-
25
-
26
-
27
-
28
-
29
-
30
-
31
-
32
-
33
-
34
-
35
-
36
-
37
-
38
-
39
-
40
-
41
-
42
-
43
-
44
-
45
-
46
-
47
-
48
-
49
-
50
-
51
-
52
-
53
-
54
-
55
-
56
-
57
-
58
-
59
-
60
-
61
-
62
-
63
-
64
-
65
-
66
-
67
-
68
-
69
-
70
-
71
-
72
-
73
-
74
-
75
-
76
-
77
-
78
-
79
-
80
-
81
-
82
-
83
-
84
-
85
-
86
-
87
-
88
-
89
-
90
-
91
-
92
-
93
-
94
-
95
-
96
-
97
-
98
-
99
-
100
-
101
-
102
-
103
-
104
-
105
-
106
-
107
-
108
-
109
-
110
-
111
-
112
-
113
-
114
-
115
-
116
-
117
-
118
-
119
-
120
-
121
-
122
-
123
-
124
-
125
-
126
-
127
-
128
-
129
-
130
-
131
-
132
-
133
-
134
-
135
-
136
-
137
-
138
-
139
-
140
-
141
-
142
-
143
-
144
-
 145
145 -
 146
146 -
 147
147 -
 148
148 -
 149
149 -
 150
150 -
 151
151 -
 152
152 -
 153
153 -
 154
154 -
 155
155 -
 156
156 -
 157
157 -
 158
158 -
 159
159 -
 160
160 -
 161
161 -
 162
162 -
 163
163 -
 164
164 -
 165
165 -
166
-
167
-
168
-
169
-
170
-
171
-
172
-
173
-
174
-
175
-
176
-
177
-
178
-
179
-
180
-
181
-
182
-
183
-
184
-
185
-
186
-
187
-
188
-
189
-
190
-
191
-
192
-
193
-
194
-
195
-
196
-
197
-
198
-
199
-
200
-
201
-
202
-
203
-
204
-
205
-
206
-
207
-
208
-
209
-
210
-
211
-
212
-
213
-
214
-
215
-
216
-
217
-
218
-
219
-
220
-
221
-
222
-
223
-
224
-
225
-
226
-
227
-
228
-
229
-
230
-
231
-
232
-
233
-
234
-
235
-
236
-
237
-
238
-
239
-
240
-
241
-
242
-
243
-
244
-
245
-
246
-
247
-
248
-
249
-
250
-
251
-
252
-
253
-
254
-
255
-
256
-
257
-
258
-
259
-
260
-
261
-
262
-
263
-
264
-
265
-
266
-
267
-
268
-
269
-
270
-
271
-
272
-
273
-
274
-
275
-
276
-
277
-
278
-
279
-
280
-
281
-
282
-
283
-
284
-
285
-
286
-
287
-
288
-
289
-
290
-
291
-
292
-
293
-
294
-
295
-
296
-
297
-
298
-
299
-
300
-
301
-
302
-
303
-
304
-
305
-
306
-
307
-
308
-
309
-
310
-
311
-
312
-
313
-
314
-
315
-
316
-
317
-
318
-
319
-
320
-
321
-
322
-
323
-
324
-
325
-
326
-
327
-
328
-
329
-
330
-
331
-
332
-
333
-
334
-
335
 |
 |

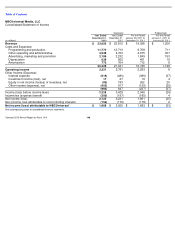
Table of Contents
NBCUniversal Media, LLC
Consolidated Statement of Cash Flows
See accompanying notes to consolidated financial statements.
Successor
Predecessor
(in millions)
Year Ended
December 31,
2013
Year Ended
December 31,
2012
For the Period
January 29, 2011 to
December 31, 2011
For the Period
January 1, 2011 to
January 28, 2011
Operating Activities
Net income (loss)
$
2,122
$
3,231
$
1,861
$
(25
)
Adjustments to reconcile net income (loss) to net cash provided by
(used in) operating activities:
Depreciation and amortization
1,411
1,326
1,113
27
Amortization of film and television costs
8,185
9,399
6,766
549
Noncash compensation expense
7
7
17
48
Equity in net (income) losses of investees, net
93
(183
)
(262
)
(25
)
Cash received from investees
90
189
301
Net (gain) loss on investment activity and other
345
(1,093
)
30
27
Deferred income taxes
(10
)
15
27
(473
)
Changes in operating assets and liabilities, net of effects of
acquisitions and divestitures:
Change in current and noncurrent receivables, net
(752
)
(643
)
(357
)
(675
)
Change in film and television costs
(8,183
)
(9,299
)
(7,018
)
(590
)
Change in accounts payable and accrued expenses related to
trade creditors
(789
)
51
95
399
Change in other operating assets and liabilities
505
333
296
109
Net cash provided by (used in) operating activities
3,024
3,333
2,869
(629
)
Investing Activities
Capital expenditures
(1,160
)
(763
)
(432
)
(16
)
Cash paid for intangible assets
(113
)
(113
)
(249
)
—
Acquisitions of real estate properties
(1,705
)
—
—
—
Acquisitions, net of cash acquired
(111
)
(90
)
(746
)
—
Proceeds from sales of businesses and investments
2
3,026
117
331
Return of capital from investees
131
75
—
—
Purchases of investments
(236
)
(117
)
(14
)
—
Other
(20
)
(9
)
(8
)
—
Net cash provided by (used in) investing activities
(3,212
)
2,009
(1,332
)
315
Financing Activities
Proceeds from (repayments of) short-term borrowings, net
—
(
550
)
550
—
Proceeds from third party borrowings
—
1,995
—
—
Repurchases and repayments of debt
(92
)
(413
)
(1,044
)
—
Proceeds from borrowings from Comcast
799
—
250
—
Repayments of borrowings from Comcast
—
—
(
250
)
—
Decrease in short
-
term loans to GE, net
—
—
—
8,072
Dividends paid
—
—
(
315
)
(8,041
)
Redemption Transaction distribution
(3,200
)
—
—
—
Distributions to member
(1,422
)
(964
)
(244
)
—
Repurchase of preferred stock interest
—
—
—
(
332
)
Distributions to noncontrolling interests
(183
)
(216
)
(187
)
—
Settlement of Station Venture liability
(602
)
—
—
—
Other
(66
)
(81
)
3
1
Net cash provided by (used in) financing activities
(4,766
)
(229
)
(1,237
)
(300
)
Increase (decrease) in cash and cash equivalents
(4,954
)
5,113
300
(614
)
Cash and cash equivalents, beginning of year
5,921
808
508
1,084
Cash and cash equivalents, end of year
$
967
$
5,921
$
808
$
470
Comcast 2013 Annual Report on Form 10-K
150