Comcast 2013 Annual Report Download - page 179
Download and view the complete annual report
Please find page 179 of the 2013 Comcast annual report below. You can navigate through the pages in the report by either clicking on the pages listed below, or by using the keyword search tool below to find specific information within the annual report.-
 1
1 -
2
-
3
-
4
-
5
-
6
-
7
-
8
-
9
-
10
-
11
-
12
-
13
-
14
-
15
-
16
-
17
-
18
-
19
-
20
-
21
-
22
-
23
-
24
-
25
-
26
-
27
-
28
-
29
-
30
-
31
-
32
-
33
-
34
-
35
-
36
-
37
-
38
-
39
-
40
-
41
-
42
-
43
-
44
-
45
-
46
-
47
-
48
-
49
-
50
-
51
-
52
-
53
-
54
-
55
-
56
-
57
-
58
-
59
-
60
-
61
-
62
-
63
-
64
-
65
-
66
-
67
-
68
-
69
-
70
-
71
-
72
-
73
-
74
-
75
-
76
-
77
-
78
-
79
-
80
-
81
-
82
-
83
-
84
-
85
-
86
-
87
-
88
-
89
-
90
-
91
-
92
-
93
-
94
-
95
-
96
-
97
-
98
-
99
-
100
-
101
-
102
-
103
-
104
-
105
-
106
-
107
-
108
-
109
-
110
-
111
-
112
-
113
-
114
-
115
-
116
-
117
-
118
-
119
-
120
-
121
-
122
-
123
-
124
-
125
-
126
-
127
-
128
-
129
-
130
-
131
-
132
-
133
-
134
-
135
-
136
-
137
-
138
-
139
-
140
-
141
-
142
-
143
-
144
-
145
-
146
-
147
-
148
-
149
-
150
-
151
-
152
-
153
-
154
-
155
-
156
-
157
-
158
-
159
-
160
-
161
-
162
-
163
-
164
-
165
-
166
-
167
-
168
-
 169
169 -
 170
170 -
 171
171 -
 172
172 -
 173
173 -
 174
174 -
 175
175 -
 176
176 -
 177
177 -
 178
178 -
 179
179 -
 180
180 -
 181
181 -
 182
182 -
 183
183 -
 184
184 -
 185
185 -
 186
186 -
 187
187 -
 188
188 -
 189
189 -
190
-
191
-
192
-
193
-
194
-
195
-
196
-
197
-
198
-
199
-
200
-
201
-
202
-
203
-
204
-
205
-
206
-
207
-
208
-
209
-
210
-
211
-
212
-
213
-
214
-
215
-
216
-
217
-
218
-
219
-
220
-
221
-
222
-
223
-
224
-
225
-
226
-
227
-
228
-
229
-
230
-
231
-
232
-
233
-
234
-
235
-
236
-
237
-
238
-
239
-
240
-
241
-
242
-
243
-
244
-
245
-
246
-
247
-
248
-
249
-
250
-
251
-
252
-
253
-
254
-
255
-
256
-
257
-
258
-
259
-
260
-
261
-
262
-
263
-
264
-
265
-
266
-
267
-
268
-
269
-
270
-
271
-
272
-
273
-
274
-
275
-
276
-
277
-
278
-
279
-
280
-
281
-
282
-
283
-
284
-
285
-
286
-
287
-
288
-
289
-
290
-
291
-
292
-
293
-
294
-
295
-
296
-
297
-
298
-
299
-
300
-
301
-
302
-
303
-
304
-
305
-
306
-
307
-
308
-
309
-
310
-
311
-
312
-
313
-
314
-
315
-
316
-
317
-
318
-
319
-
320
-
321
-
322
-
323
-
324
-
325
-
326
-
327
-
328
-
329
-
330
-
331
-
332
-
333
-
334
-
335
 |
 |

Table of Contents
NBCUniversal Media, LLC
(c)
Headquarters and Other activities includes costs associated with overhead, allocations, personnel costs and corporate initiatives.
(d)
Eliminations for the periods January 1, 2011 through January 28, 2011 and January 29, 2011 through June 30, 2011 included the eliminations of the results of operations
for Universal Orlando for these periods. These results were not included in our consolidated results of operations because we recorded Universal Orlando as an equity
method investment during those periods.
Also included in Eliminations are transactions that our segments enter into with one another, which consisted primarily of the licensing of film and television content from
our Filmed Entertainment and Broadcast Television segments to our Cable Networks segment.
(e)
No single customer accounted for a significant amount of revenue in any period.
(f)
We use operating income (loss) before depreciation and amortization, excluding impairment charges related to fixed and intangible assets and gains or losses from the
sale of assets, if any, as the measure of profit or loss for our operating segments. This measure eliminates the significant level of noncash amortization expense that
results from intangible assets recognized in connection with the Joint Venture transaction and other business combinations. Additionally, it is unaffected by our capital
structure or investment activities. We use this measure to evaluate our consolidated operating performance and the operating performance of our operating segments and
to allocate resources and capital to our operating segments. It is also a significant performance measure in our annual incentive compensation programs. We believe that
this measure is useful to investors because it is one of the bases for comparing our operating performance with that of other companies in our industries, although our
measure may not be directly comparable to similar measures used by other companies. This measure should not be considered a substitute for operating income (loss),
net income (loss) attributable to NBCUniversal, net cash provided by operating activities, or other measures of performance or liquidity we have reported in accordance
with GAAP.
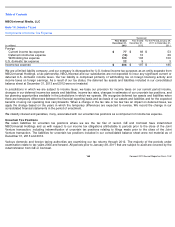
(g)
We operate primarily in the United States, but also in select international markets primarily in Europe and Asia. The table below summarizes revenue by geographic
location.
Successor
Predecessor
(in millions)
Year Ended
December 31,
2013
Year Ended
December 31,
2012
For the Period
January 29, 2011 to
December 31, 2011
For the Period
January 1, 2011 to
January 28, 2011
Revenue:
United States
$
18,887
$
19,348
$
14,927
$
935
Foreign
$
4,763
$
4,464
$
4,101
$
271
Comcast 2013 Annual Report on Form 10
-
K
174