Comcast 2013 Annual Report Download - page 48
Download and view the complete annual report
Please find page 48 of the 2013 Comcast annual report below. You can navigate through the pages in the report by either clicking on the pages listed below, or by using the keyword search tool below to find specific information within the annual report.-
 1
1 -
2
-
3
-
4
-
5
-
6
-
7
-
8
-
9
-
10
-
11
-
12
-
13
-
14
-
15
-
16
-
17
-
18
-
19
-
20
-
21
-
22
-
23
-
24
-
25
-
26
-
27
-
28
-
29
-
30
-
31
-
32
-
33
-
34
-
35
-
36
-
37
-
 38
38 -
 39
39 -
 40
40 -
 41
41 -
 42
42 -
 43
43 -
 44
44 -
 45
45 -
 46
46 -
 47
47 -
 48
48 -
 49
49 -
 50
50 -
 51
51 -
 52
52 -
 53
53 -
 54
54 -
 55
55 -
 56
56 -
 57
57 -
 58
58 -
59
-
60
-
61
-
62
-
63
-
64
-
65
-
66
-
67
-
68
-
69
-
70
-
71
-
72
-
73
-
74
-
75
-
76
-
77
-
78
-
79
-
80
-
81
-
82
-
83
-
84
-
85
-
86
-
87
-
88
-
89
-
90
-
91
-
92
-
93
-
94
-
95
-
96
-
97
-
98
-
99
-
100
-
101
-
102
-
103
-
104
-
105
-
106
-
107
-
108
-
109
-
110
-
111
-
112
-
113
-
114
-
115
-
116
-
117
-
118
-
119
-
120
-
121
-
122
-
123
-
124
-
125
-
126
-
127
-
128
-
129
-
130
-
131
-
132
-
133
-
134
-
135
-
136
-
137
-
138
-
139
-
140
-
141
-
142
-
143
-
144
-
145
-
146
-
147
-
148
-
149
-
150
-
151
-
152
-
153
-
154
-
155
-
156
-
157
-
158
-
159
-
160
-
161
-
162
-
163
-
164
-
165
-
166
-
167
-
168
-
169
-
170
-
171
-
172
-
173
-
174
-
175
-
176
-
177
-
178
-
179
-
180
-
181
-
182
-
183
-
184
-
185
-
186
-
187
-
188
-
189
-
190
-
191
-
192
-
193
-
194
-
195
-
196
-
197
-
198
-
199
-
200
-
201
-
202
-
203
-
204
-
205
-
206
-
207
-
208
-
209
-
210
-
211
-
212
-
213
-
214
-
215
-
216
-
217
-
218
-
219
-
220
-
221
-
222
-
223
-
224
-
225
-
226
-
227
-
228
-
229
-
230
-
231
-
232
-
233
-
234
-
235
-
236
-
237
-
238
-
239
-
240
-
241
-
242
-
243
-
244
-
245
-
246
-
247
-
248
-
249
-
250
-
251
-
252
-
253
-
254
-
255
-
256
-
257
-
258
-
259
-
260
-
261
-
262
-
263
-
264
-
265
-
266
-
267
-
268
-
269
-
270
-
271
-
272
-
273
-
274
-
275
-
276
-
277
-
278
-
279
-
280
-
281
-
282
-
283
-
284
-
285
-
286
-
287
-
288
-
289
-
290
-
291
-
292
-
293
-
294
-
295
-
296
-
297
-
298
-
299
-
300
-
301
-
302
-
303
-
304
-
305
-
306
-
307
-
308
-
309
-
310
-
311
-
312
-
313
-
314
-
315
-
316
-
317
-
318
-
319
-
320
-
321
-
322
-
323
-
324
-
325
-
326
-
327
-
328
-
329
-
330
-
331
-
332
-
333
-
334
-
335
 |
 |

Table of Contents
The table below summarizes our repurchases under our Board-
authorized share repurchase program during 2013. Under our share
repurchase program, our Board gives management discretion to purchase either Class A or Class A Special common stock. During
2013, the Class A Special common stock traded at a discount to the Class A common stock and all of the shares repurchased were
of Class A Special common stock. Subject to market conditions, including the amount of any price differential between the two
classes of common stock, we currently expect to continue to repurchase primarily Class A Special common stock under our share
repurchase program.
The total number of shares purchased during 2013 does not include any shares received in the administration of employee share-
based compensation plans.
In January 2014, our Board of Directors increased our share repurchase program authorization to $7.5 billion, which does not have
an expiration date. Under this authorization, we may repurchase shares in the open market or in private transactions. We expect to
repurchase $3 billion of shares during 2014, subject to market conditions.
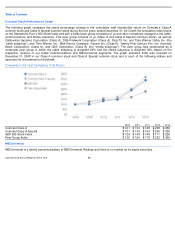
Comcast Common Stock Sales Price Table
The following table sets forth, for the indicated periods, the high and low sales prices of Comcast’
s Class A and Class A Special
common stock.
Period
Total Number of
Shares
Purchased
Average
Price Per
Share
Total Number of
Shares
Purchased as
Part of Publicly
Announced
Authorization
Total Dollar
Amount
Purchased Under
the Authorization
Maximum Dollar
Value of Shares That
May Yet Be Purchased
Under the
Authorization
First Quarter 2013
13,285,909
$
37.63
13,285,909
$
500,000,000
$
3,000,000,000
Second Quarter 2013
12,622,459
$
39.61
12,622,459
$
500,000,000
$
2,500,000,000
Third Quarter 2013
12,003,261
$
41.66
12,003,261
$
500,000,000
$
2,000,000,000
October 1
-
31, 2013
—
$
—
—
$
—
$
2,000,000,000
November 1
-
30, 2013
5,536,264
$
45.16
5,536,264
$
250,000,000
$
1,750,000,000
December 1-31, 2013
5,292,452
$
47.24
5,292,452
$
250,000,000
$
1,500,000,000
Total
48,740,345
$
41.03
48,740,345
$
2,000,000,000
$
1,500,000,000
(a)
In February 2012, our Board of Directors approved a $6.5 billion share repurchase authorization, which does not have an expiration date. Under this authorization, we
may repurchase shares in the open market or in private transactions.
Class A
Class A Special
High
Low
High
Low
2013
First Quarter
$
42.01
$
37.21
$
40.33
$
35.84
Second Quarter
$
43.74
$
38.75
$
41.88
$
37.35
Third Quarter
$
46.33
$
40.26
$
46.00
$
38.55
Fourth Quarter
$
52.09
$
44.09
$
49.94
$
42.62
2012
First Quarter
$
30.41
$
24.28
$
30.00
$
23.97
Second Quarter
$
31.99
$
28.09
$
31.48
$
27.80
Third Quarter
$
36.90
$
31.04
$
35.83
$
30.60
Fourth Quarter
$
38.22
$
34.94
$
36.91
$
34.00
43
Comcast 2013 Annual Report on Form 10
-
K
(a)