Comcast 2013 Annual Report Download - page 323
Download and view the complete annual report
Please find page 323 of the 2013 Comcast annual report below. You can navigate through the pages in the report by either clicking on the pages listed below, or by using the keyword search tool below to find specific information within the annual report.-
 1
1 -
2
-
3
-
4
-
5
-
6
-
7
-
8
-
9
-
10
-
11
-
12
-
13
-
14
-
15
-
16
-
17
-
18
-
19
-
20
-
21
-
22
-
23
-
24
-
25
-
26
-
27
-
28
-
29
-
30
-
31
-
32
-
33
-
34
-
35
-
36
-
37
-
38
-
39
-
40
-
41
-
42
-
43
-
44
-
45
-
46
-
47
-
48
-
49
-
50
-
51
-
52
-
53
-
54
-
55
-
56
-
57
-
58
-
59
-
60
-
61
-
62
-
63
-
64
-
65
-
66
-
67
-
68
-
69
-
70
-
71
-
72
-
73
-
74
-
75
-
76
-
77
-
78
-
79
-
80
-
81
-
82
-
83
-
84
-
85
-
86
-
87
-
88
-
89
-
90
-
91
-
92
-
93
-
94
-
95
-
96
-
97
-
98
-
99
-
100
-
101
-
102
-
103
-
104
-
105
-
106
-
107
-
108
-
109
-
110
-
111
-
112
-
113
-
114
-
115
-
116
-
117
-
118
-
119
-
120
-
121
-
122
-
123
-
124
-
125
-
126
-
127
-
128
-
129
-
130
-
131
-
132
-
133
-
134
-
135
-
136
-
137
-
138
-
139
-
140
-
141
-
142
-
143
-
144
-
145
-
146
-
147
-
148
-
149
-
150
-
151
-
152
-
153
-
154
-
155
-
156
-
157
-
158
-
159
-
160
-
161
-
162
-
163
-
164
-
165
-
166
-
167
-
168
-
169
-
170
-
171
-
172
-
173
-
174
-
175
-
176
-
177
-
178
-
179
-
180
-
181
-
182
-
183
-
184
-
185
-
186
-
187
-
188
-
189
-
190
-
191
-
192
-
193
-
194
-
195
-
196
-
197
-
198
-
199
-
200
-
201
-
202
-
203
-
204
-
205
-
206
-
207
-
208
-
209
-
210
-
211
-
212
-
213
-
214
-
215
-
216
-
217
-
218
-
219
-
220
-
221
-
222
-
223
-
224
-
225
-
226
-
227
-
228
-
229
-
230
-
231
-
232
-
233
-
234
-
235
-
236
-
237
-
238
-
239
-
240
-
241
-
242
-
243
-
244
-
245
-
246
-
247
-
248
-
249
-
250
-
251
-
252
-
253
-
254
-
255
-
256
-
257
-
258
-
259
-
260
-
261
-
262
-
263
-
264
-
265
-
266
-
267
-
268
-
269
-
270
-
271
-
272
-
273
-
274
-
275
-
276
-
277
-
278
-
279
-
280
-
281
-
282
-
283
-
284
-
285
-
286
-
287
-
288
-
289
-
290
-
291
-
292
-
293
-
294
-
295
-
296
-
297
-
298
-
299
-
300
-
301
-
302
-
303
-
304
-
305
-
306
-
307
-
308
-
309
-
310
-
311
-
312
-
 313
313 -
 314
314 -
 315
315 -
 316
316 -
 317
317 -
 318
318 -
 319
319 -
 320
320 -
 321
321 -
 322
322 -
 323
323 -
 324
324 -
 325
325 -
 326
326 -
 327
327 -
 328
328 -
 329
329 -
 330
330 -
 331
331 -
 332
332 -
 333
333 -
334
-
335
 |
 |

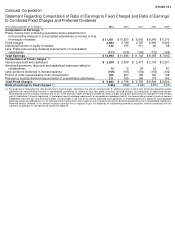
Exhibit 12.1
Comcast Corporation
Statement Regarding Computation of Ratio of Earnings to Fixed Charges and Ratio of Earnings
to Combined Fixed Charges and Preferred Dividends
Year Ended December 31 (in millions)
2013
2012
2011
2010
2009
Computation of Earnings:
Pretax income from continuing operations before adjustment for
noncontrolling interests in consolidated subsidiaries or income or loss
from equity investees
$
11,201
$
10,650
$
8,242
$
6,245
$
5,170
Fixed charges
2,882
2,798
2,755
2,366
2,529
Distributed income of equity investees
120
195
311
20
48
Less: Preference security dividend requirements of consolidated
subsidiaries
(211
)
(155
)
(166
)
(173
)
(145
)
Total Earnings
$
13,992
$
13,488
$
11,142
$
8,458
$
7,602
Computation of Fixed charges:
Interest expensed and capitalized
$
2,559
$
2,508
$
2,477
$
2,134
$
2,267
Amortized premiums, discounts and capitalized expenses related to
indebtedness
15
13
28
22
81
Less: preferred dividends in interest expense
(106
)
(105
)
(104
)
(103
)
(102
)
Portion of rents representative of an interest factor
203
227
188
140
138
Preference security dividend requirements of consolidated subsidiaries
211
155
166
173
145
Total Fixed Charges
$
2,882
$
2,798
$
2,755
$
2,366
$
2,529
Ratio of earnings to fixed charges
4.85
x
4.82
x
4.04
x
3.57
x
3.01
x
(a)
For purposes of calculating the ratio of earnings to fixed charges, earnings is the amount resulting from (1) adding (a) pretax income from continuing operations before
adjustment for noncontrolling interests in consolidated subsidiaries or income or loss from equity investees, (b) fixed charges, (c) amortization of capitalized interest,
(d) distributed income of equity investees and (e) our share of pretax losses of equity investees for which charges arising from guarantees are included in fixed charges
and (2) subtracting (i) interest capitalized, (ii) preference security dividend requirements of consolidated subsidiaries and (iii) the noncontrolling interest in pretax income of
subsidiaries that have not incurred fixed charges. Fixed charges is the sum of (w) interest expensed and capitalized, (x) amortized premiums, discounts and capitalized
expenses related to indebtedness, (y) an estimate of the interest within rental expense and (z) preference security dividend requirements of our consolidated subsidiaries.
Preferred security dividend is the amount of pretax earnings that is required to pay the dividends on outstanding preference securities. Interest associated with our
uncertain tax positions is a component of income tax expense.
(a)
(a)
(a)