Comcast 2013 Annual Report Download - page 62
Download and view the complete annual report
Please find page 62 of the 2013 Comcast annual report below. You can navigate through the pages in the report by either clicking on the pages listed below, or by using the keyword search tool below to find specific information within the annual report.-
 1
1 -
2
-
3
-
4
-
5
-
6
-
7
-
8
-
9
-
10
-
11
-
12
-
13
-
14
-
15
-
16
-
17
-
18
-
19
-
20
-
21
-
22
-
23
-
24
-
25
-
26
-
27
-
28
-
29
-
30
-
31
-
32
-
33
-
34
-
35
-
36
-
37
-
38
-
39
-
40
-
41
-
42
-
43
-
44
-
45
-
46
-
47
-
48
-
49
-
50
-
51
-
 52
52 -
 53
53 -
 54
54 -
 55
55 -
 56
56 -
 57
57 -
 58
58 -
 59
59 -
 60
60 -
 61
61 -
 62
62 -
 63
63 -
 64
64 -
 65
65 -
 66
66 -
 67
67 -
 68
68 -
 69
69 -
 70
70 -
 71
71 -
 72
72 -
73
-
74
-
75
-
76
-
77
-
78
-
79
-
80
-
81
-
82
-
83
-
84
-
85
-
86
-
87
-
88
-
89
-
90
-
91
-
92
-
93
-
94
-
95
-
96
-
97
-
98
-
99
-
100
-
101
-
102
-
103
-
104
-
105
-
106
-
107
-
108
-
109
-
110
-
111
-
112
-
113
-
114
-
115
-
116
-
117
-
118
-
119
-
120
-
121
-
122
-
123
-
124
-
125
-
126
-
127
-
128
-
129
-
130
-
131
-
132
-
133
-
134
-
135
-
136
-
137
-
138
-
139
-
140
-
141
-
142
-
143
-
144
-
145
-
146
-
147
-
148
-
149
-
150
-
151
-
152
-
153
-
154
-
155
-
156
-
157
-
158
-
159
-
160
-
161
-
162
-
163
-
164
-
165
-
166
-
167
-
168
-
169
-
170
-
171
-
172
-
173
-
174
-
175
-
176
-
177
-
178
-
179
-
180
-
181
-
182
-
183
-
184
-
185
-
186
-
187
-
188
-
189
-
190
-
191
-
192
-
193
-
194
-
195
-
196
-
197
-
198
-
199
-
200
-
201
-
202
-
203
-
204
-
205
-
206
-
207
-
208
-
209
-
210
-
211
-
212
-
213
-
214
-
215
-
216
-
217
-
218
-
219
-
220
-
221
-
222
-
223
-
224
-
225
-
226
-
227
-
228
-
229
-
230
-
231
-
232
-
233
-
234
-
235
-
236
-
237
-
238
-
239
-
240
-
241
-
242
-
243
-
244
-
245
-
246
-
247
-
248
-
249
-
250
-
251
-
252
-
253
-
254
-
255
-
256
-
257
-
258
-
259
-
260
-
261
-
262
-
263
-
264
-
265
-
266
-
267
-
268
-
269
-
270
-
271
-
272
-
273
-
274
-
275
-
276
-
277
-
278
-
279
-
280
-
281
-
282
-
283
-
284
-
285
-
286
-
287
-
288
-
289
-
290
-
291
-
292
-
293
-
294
-
295
-
296
-
297
-
298
-
299
-
300
-
301
-
302
-
303
-
304
-
305
-
306
-
307
-
308
-
309
-
310
-
311
-
312
-
313
-
314
-
315
-
316
-
317
-
318
-
319
-
320
-
321
-
322
-
323
-
324
-
325
-
326
-
327
-
328
-
329
-
330
-
331
-
332
-
333
-
334
-
335
 |
 |

Table of Contents
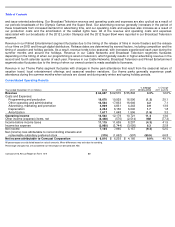
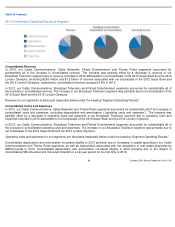
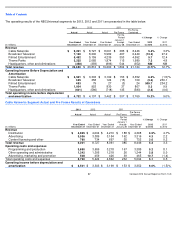
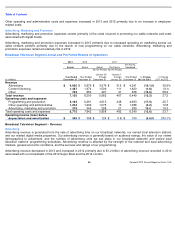
The operating results of the NBCUniversal segments for 2013, 2012 and 2011 are presented in the table below.
Cable Networks Segment Actual and Pro Forma Results of Operations
2013
2012
2011
Actual
Actual
Actual
Pro Forma
Pro Forma
Combined
(in millions)
Year Ended
December 31
Year Ended
December 31
Year Ended
December 31
For the
Period
January 1
through
January 28
Year Ended
December 31
% Change
2012
to 2013
% Change
2011
to 2012
Revenue
Cable Networks
$
9,201
$
8,727
$
8,061
$
385
$
8,446
5.4
%
3.3
%
Broadcast Television
7,120
8,200
5,982
467
6,449
(13.2
)
27.2
Filmed Entertainment
5,452
5,159
4,239
353
4,592
5.7
12.4
Theme Parks
2,235
2,085
1,874
115
1,989
7.2
4.8
Headquarters, other and eliminations
(358
)
(359
)
(896
)
544
(352
)
NM
NM
Total revenue
$
23,650
$
23,812
$
19,260
$
1,864
$
21,124
(0.7
)%
12.7
%
Operating Income Before Depreciation and
Amortization
Cable Networks
$
3,501
$
3,303
$
3,199
$
153
$
3,352
6.0
%
(1.5
)%
Broadcast Television
345
358
124
(15
)
109
(3.6
)
230.1
Filmed Entertainment
483
79
27
(3
)
24
509.7
234.2
Theme Parks
1,004
953
830
37
867
5.3
9.9
Headquarters, other and eliminations
(601
)
(586
)
(718
)
135
(583
)
(2.3
)
(0.6
)
Total operating income before depreciation
and amortization
$
4,732
$
4,107
$
3,462
$
307
$
3,769
15.2
%
9.0
%
2013
2012
2011
Actual
Actual
Actual
Pro Forma
Pro Forma
Combined
(in millions)
Year Ended
December 31
Year Ended
December 31
Year Ended
December 31
For the
Period
January 1
through
January 28
Year Ended
December 31
% Change
2012
to 2013
% Change
2011
to 2012
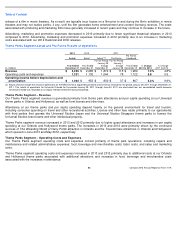
Revenue
Distribution
$
4,905
$
4,604
$
4,210
$
188
$
4,398
6.5
%
4.7
%
Advertising
3,536
3,389
3,154
162
3,316
4.3
2.2
Content licensing and other
760
734
697
35
732
3.6
0.2
Total revenue
9,201
8,727
8,061
385
8,446
5.4
3.3
Operating costs and expenses
Programming and production
3,850
3,659
3,218
167
3,385
5.2
8.1
Other operating and administrative
1,342
1,306
1,218
26
1,244
2.8
5.0
Advertising, marketing and promotion
508
459
426
39
465
10.7
(1.4
)
Total operating costs and expenses
5,700
5,424
4,862
232
5,094
5.1
6.5
Operating income before depreciation and
amortization
$
3,501
$
3,303
$
3,199
$
153
$
3,352
6.0
%
(1.5
)%
57
Comcast 2013 Annual Report on Form 10
-
K