Classmates.com 2009 Annual Report Download - page 82
Download and view the complete annual report
Please find page 82 of the 2009 Classmates.com annual report below. You can navigate through the pages in the report by either clicking on the pages listed below, or by using the keyword search tool below to find specific information within the annual report.-
 1
1 -
2
-
3
-
4
-
5
-
6
-
7
-
8
-
9
-
10
-
11
-
12
-
13
-
14
-
15
-
16
-
17
-
18
-
19
-
20
-
21
-
22
-
23
-
24
-
25
-
26
-
27
-
28
-
29
-
30
-
31
-
32
-
33
-
34
-
35
-
36
-
37
-
38
-
39
-
40
-
41
-
42
-
43
-
44
-
45
-
46
-
47
-
48
-
49
-
50
-
51
-
52
-
53
-
54
-
55
-
56
-
57
-
58
-
59
-
60
-
61
-
62
-
63
-
64
-
65
-
66
-
67
-
68
-
69
-
70
-
71
-
 72
72 -
 73
73 -
 74
74 -
 75
75 -
 76
76 -
 77
77 -
 78
78 -
 79
79 -
 80
80 -
 81
81 -
 82
82 -
 83
83 -
 84
84 -
 85
85 -
 86
86 -
 87
87 -
 88
88 -
 89
89 -
 90
90 -
 91
91 -
 92
92 -
93
-
94
-
95
-
96
-
97
-
98
-
99
-
100
-
101
-
102
-
103
-
104
-
105
-
106
-
107
-
108
-
109
-
110
-
111
-
112
-
113
-
114
-
115
-
116
-
117
-
118
-
119
-
120
-
121
-
122
-
123
-
124
-
125
-
126
-
127
-
128
-
129
-
130
-
131
-
132
-
133
-
134
-
135
-
136
-
137
-
138
-
139
-
140
-
141
-
142
-
143
-
144
-
145
-
146
-
147
-
148
-
149
-
150
-
151
-
152
-
153
-
154
-
155
-
156
-
157
-
158
-
159
-
160
-
161
-
162
-
163
-
164
-
165
-
166
-
167
-
168
-
169
-
170
-
171
-
172
-
173
-
174
-
175
-
176
-
177
-
178
-
179
-
180
-
181
-
182
-
183
-
184
 |
 |

Table of Contents
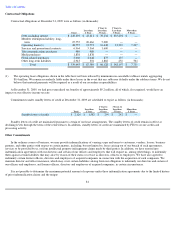
development and/or acquisition of other services, businesses or technologies; the repurchase of our common stock underlying restricted stock
units and stock awards to pay the employee withholding taxes due on vested restricted stock units and stock awards issued; the repurchase of our
common stock under the program; and future capital expenditures.
Under the terms of the UOL Credit Agreement and the FTD Credit Agreement, there are significant limitations on our ability to use cash
flows generated by our Communications and Classmates Media segments for the benefit of the FTD segment and, conversely, there are
significant limitations on our ability to use cash flows generated by the FTD segment for the benefit of United Online, Inc. or the
Communications and Classmates Media segments. Our credit facilities include provisions which may require us to make debt prepayments in the
event that we generate excess cash flow, as defined in the UOL Credit Agreement and the FTD Credit Agreement, on a quarterly or annual basis,
respectively. The assessments of future excess cash flow for UOL, excluding FTD, and for FTD on a standalone basis require us to forecast our
respective cash flows from operations less certain cash outflows, including, but not limited to, those related to capital expenditures and income
taxes. Based on our current projections, under the provisions of our credit facilities, we reasonably expect to make excess cash flow debt
prepayments of approximately $11.0 million in the next twelve months. Accordingly, this amount has been classified as a current liability on our
consolidated balance sheet at December 31, 2009. The determination of excess cash flow obligations requires us to make significant estimates
regarding our cash flows from operations, capital expenditures, income taxes, and other items. Actual results could differ from our current
projections and we could be required to pay materially different amounts under the excess cash flow provisions of our credit facilities. The
degree to which our assets are leveraged and the terms of our debt could materially and adversely affect our ability to obtain additional capital as
well as the terms at which such capital might be offered to us. We currently expect to have sufficient liquidity to fulfill our debt service
obligations, at least in the next twelve months. In addition, in 2009, we made voluntary prepayments on the FTD Credit Agreement totaling
$57.0 million, eliminating all required payments in 2010. We have not yet determined whether we will make additional voluntary prepayments
in 2010.
If we need to raise additional capital through public or private debt or equity financings, strategic relationships or other arrangements, this
capital might not be available to us in a timely manner, on acceptable terms, or at all. Our failure to raise sufficient capital when needed could
severely constrain or prevent us from, among other factors, developing new or enhancing existing services or products, repurchasing our
common stock, acquiring other services, businesses or technologies or funding significant capital expenditures, and have a material adverse
effect on our business, financial position, results of operations, and cash flows as well as impair our ability to pay future dividends. If additional
funds were raised through the issuance of equity or convertible debt securities, the percentage of stock owned by the then-current stockholders
could be reduced. Furthermore, such equity or debt securities that we issue might have rights, preferences or privileges senior to holders of our
common stock. In addition, the extreme volatility and disruption in the securities and credit markets may restrict our ability to raise any such
additional funds, at least in the near term.
Year Ended December 31, 2008 compared to Year Ended December 31, 2007
Net cash provided by operating activities increased by $36.8 million, or 28.9%, for the year ended December 31, 2008 compared to the year
ended December 31, 2007. Net cash provided by operating activities is driven by our net income adjusted for non-cash items, including, but not
limited to, depreciation and amortization, stock-based compensation, impairment of goodwill, intangible assets and long-lived assets, deferred
taxes, tax benefits from equity awards and changes in operating assets and liabilities. The increase was primarily due to a $176.4 million increase
in non-
cash items and a $13.7 million favorable change in operating assets and liabilities, partially offset by a $152.4 million increase in net loss.
79