Classmates.com 2009 Annual Report Download - page 64
Download and view the complete annual report
Please find page 64 of the 2009 Classmates.com annual report below. You can navigate through the pages in the report by either clicking on the pages listed below, or by using the keyword search tool below to find specific information within the annual report.-
 1
1 -
2
-
3
-
4
-
5
-
6
-
7
-
8
-
9
-
10
-
11
-
12
-
13
-
14
-
15
-
16
-
17
-
18
-
19
-
20
-
21
-
22
-
23
-
24
-
25
-
26
-
27
-
28
-
29
-
30
-
31
-
32
-
33
-
34
-
35
-
36
-
37
-
38
-
39
-
40
-
41
-
42
-
43
-
44
-
45
-
46
-
47
-
48
-
49
-
50
-
51
-
52
-
53
-
 54
54 -
 55
55 -
 56
56 -
 57
57 -
 58
58 -
 59
59 -
 60
60 -
 61
61 -
 62
62 -
 63
63 -
 64
64 -
 65
65 -
 66
66 -
 67
67 -
 68
68 -
 69
69 -
 70
70 -
 71
71 -
 72
72 -
 73
73 -
 74
74 -
75
-
76
-
77
-
78
-
79
-
80
-
81
-
82
-
83
-
84
-
85
-
86
-
87
-
88
-
89
-
90
-
91
-
92
-
93
-
94
-
95
-
96
-
97
-
98
-
99
-
100
-
101
-
102
-
103
-
104
-
105
-
106
-
107
-
108
-
109
-
110
-
111
-
112
-
113
-
114
-
115
-
116
-
117
-
118
-
119
-
120
-
121
-
122
-
123
-
124
-
125
-
126
-
127
-
128
-
129
-
130
-
131
-
132
-
133
-
134
-
135
-
136
-
137
-
138
-
139
-
140
-
141
-
142
-
143
-
144
-
145
-
146
-
147
-
148
-
149
-
150
-
151
-
152
-
153
-
154
-
155
-
156
-
157
-
158
-
159
-
160
-
161
-
162
-
163
-
164
-
165
-
166
-
167
-
168
-
169
-
170
-
171
-
172
-
173
-
174
-
175
-
176
-
177
-
178
-
179
-
180
-
181
-
182
-
183
-
184
 |
 |

Table of Contents
Provision for Income Taxes. For the year ended December 31, 2009, we recorded a tax provision of $48.1 million on pre-tax income of
$118.2 million, resulting in an effective income tax rate of 40.7%. For the year ended December 31, 2008, we recorded a tax provision of
$23.3 million on a pre-tax loss of $71.4 million. The tax provision for the year ended December 31, 2008 reflects the impact of non-deductible
goodwill and impairment charges of $176.2 million. Excluding these charges, the effective income tax rate for the year ended December 31,
2008 would have been 43.5%. The current rate has declined primarily due to the effects of net benefits resulting from statute expirations of
uncertain tax positions offset partially by the limitation of foreign tax credits.
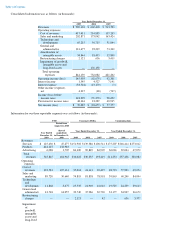
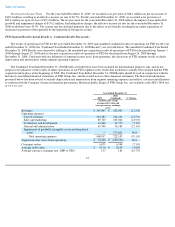
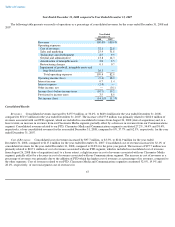
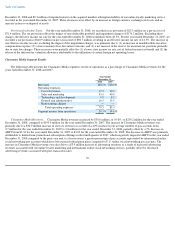
FTD Segment Results (Actual Results vs. Combined Results Discussion)
The results of operations for FTD for the year ended December 31, 2009 and unaudited combined results of operations for FTD for the year
ended December 31, 2008 (the "Combined Year Ended December 31, 2008 Results") are set forth below. The unaudited Combined Year Ended
December 31, 2008 Results were derived by adding (i) the unaudited pre-acquisition results of operations of FTD for the period from January 1,
2008 through August 25, 2008 and (ii) the post-acquisition results of operations of FTD for the period from August 26, 2008 through
December 31, 2008. Consistent with our definition of segment income (loss) from operations, the discussion of FTD segment results excludes
depreciation and amortization within segment operating expenses.
The Combined Year Ended December 31, 2008 Results set forth below have been included for informational purposes only and do not
purport to be indicative of the results of future operations of our FTD segment or the results that would have actually been attained had the FTD
acquisition taken place at the beginning of 2008. The Combined Year Ended December 31, 2008 Results should be read in conjunction with the
historical consolidated financial statements of FTD Group, Inc. and the related notes to those financial statements. The historical information
presented below has been revised to exclude depreciation and amortization from segment operating expenses and reflects certain reclassifications
to conform with the Company's financial statement presentation. Historical public filings of FTD Group, Inc. are available at the SEC's Web site
at www.sec.gov .
61
Year Ended December 31,
2009 2008
(Combined) % Change
(in thousands, except
average order value and
average currency exchange
rates)
Revenues
$
545,845
$
622,003
(12.2
)%
Operating expenses:
Cost of revenues
323,581
374,231
(13.5
)%
Sales and marketing
89,720
103,046
(12.9
)%
Technology and development
11,868
12,770
(7.1
)%
General and administrative
43,748
56,189
(22.1
)%
Impairment of goodwill, intangible assets and long-lived
assets
—
175,867
N/A
Total operating expenses
468,917
722,103
(35.1
)%
Segment income (loss) from operations
$
76,928
$
(100,100
)
N/A
Consumer orders
6,071
6,548
(7.3
)%
Average order value
$
59.56
$
62.99
(5.4
)%
Average currency exchange rate: GBP to USD
1.55
1.86
(16.7
)%