Classmates.com 2009 Annual Report Download - page 77
Download and view the complete annual report
Please find page 77 of the 2009 Classmates.com annual report below. You can navigate through the pages in the report by either clicking on the pages listed below, or by using the keyword search tool below to find specific information within the annual report.-
 1
1 -
2
-
3
-
4
-
5
-
6
-
7
-
8
-
9
-
10
-
11
-
12
-
13
-
14
-
15
-
16
-
17
-
18
-
19
-
20
-
21
-
22
-
23
-
24
-
25
-
26
-
27
-
28
-
29
-
30
-
31
-
32
-
33
-
34
-
35
-
36
-
37
-
38
-
39
-
40
-
41
-
42
-
43
-
44
-
45
-
46
-
47
-
48
-
49
-
50
-
51
-
52
-
53
-
54
-
55
-
56
-
57
-
58
-
59
-
60
-
61
-
62
-
63
-
64
-
65
-
66
-
 67
67 -
 68
68 -
 69
69 -
 70
70 -
 71
71 -
 72
72 -
 73
73 -
 74
74 -
 75
75 -
 76
76 -
 77
77 -
 78
78 -
 79
79 -
 80
80 -
 81
81 -
 82
82 -
 83
83 -
 84
84 -
 85
85 -
 86
86 -
 87
87 -
88
-
89
-
90
-
91
-
92
-
93
-
94
-
95
-
96
-
97
-
98
-
99
-
100
-
101
-
102
-
103
-
104
-
105
-
106
-
107
-
108
-
109
-
110
-
111
-
112
-
113
-
114
-
115
-
116
-
117
-
118
-
119
-
120
-
121
-
122
-
123
-
124
-
125
-
126
-
127
-
128
-
129
-
130
-
131
-
132
-
133
-
134
-
135
-
136
-
137
-
138
-
139
-
140
-
141
-
142
-
143
-
144
-
145
-
146
-
147
-
148
-
149
-
150
-
151
-
152
-
153
-
154
-
155
-
156
-
157
-
158
-
159
-
160
-
161
-
162
-
163
-
164
-
165
-
166
-
167
-
168
-
169
-
170
-
171
-
172
-
173
-
174
-
175
-
176
-
177
-
178
-
179
-
180
-
181
-
182
-
183
-
184
 |
 |

Table of Contents
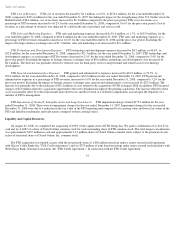
statements. The historical information presented below has been revised to exclude depreciation and amortization and reflects certain
reclassifications to conform with the Company's financial statement presentation. Historical public filings of FTD Group, Inc. are available at the
SEC's Web site at www.sec.gov .
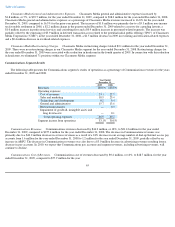
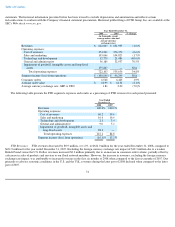
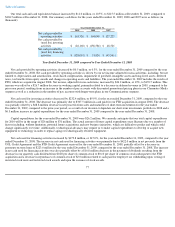
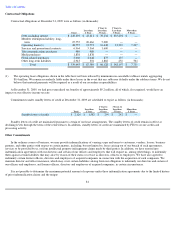
The following table presents the FTD segment's expenses and results as a percentage of FTD revenues for each period presented:
FTD Revenues. FTD revenues decreased by $9.9 million, or 1.6%, to $622.0 million for the year ended December 31, 2008, compared to
$631.9 million for the year ended December 31, 2007. Excluding the foreign currency exchange rate impact of $12.3 million due to a weaker
British Pound versus the U.S. Dollar, revenues increased $2.3 million primarily due to an increase in consumer order volume, partially offset by
a decrease in sales of products and services to our floral network members. However, the increase in revenues, excluding the foreign currency
exchange rate impact, was attributable to increased revenues in the first six months of 2008 when compared to the first six months of 2007. Due
primarily to adverse economic conditions in the U.S. and the U.K., revenues during the latter part of 2008 declined when compared to the latter
part of 2007.
74
Year Ended December 31,
2008
2007
% Change
(in thousands, except
average order value and
average currency
exchange rates)
Revenues
$
622,003
$
631,935
(1.6
)%
Operating expenses:
Cost of revenues
374,231
376,370
(0.6
)%
Sales and marketing
103,046
104,823
(1.7
)%
Technology and development
12,770
21,486
(40.6
)%
General and administrative
56,189
32,957
70.5
%
Impairment of goodwill, intangible assets and long
-
lived
assets
175,867
—
N/A
Total operating expenses
722,103
535,636
34.8
%
Segment income (loss) from operations
$
(100,100
)
$
96,299
N/A
Consumer orders
6,548
6,423
1.9
%
Average order value
$
62.99
$
64.32
(2.1
)%
Average currency exchange rate: GBP to USD
1.86
2.00
(7.0
)%
Year Ended
December 31,
2008
2007
Revenues
100.0
%
100.0
%
Operating expenses:
Cost of revenues
60.2
59.6
Sales and marketing
16.6
16.6
Technology and development
2.1
3.4
General and administrative
9.0
5.2
Impairment of goodwill, intangible assets and
long
-
lived assets
28.3
—
Total operating expenses
116.1
84.8
Segment income (loss) from operations
(16.1
)%
15.2
%