Classmates.com 2009 Annual Report Download - page 71
Download and view the complete annual report
Please find page 71 of the 2009 Classmates.com annual report below. You can navigate through the pages in the report by either clicking on the pages listed below, or by using the keyword search tool below to find specific information within the annual report.-
 1
1 -
2
-
3
-
4
-
5
-
6
-
7
-
8
-
9
-
10
-
11
-
12
-
13
-
14
-
15
-
16
-
17
-
18
-
19
-
20
-
21
-
22
-
23
-
24
-
25
-
26
-
27
-
28
-
29
-
30
-
31
-
32
-
33
-
34
-
35
-
36
-
37
-
38
-
39
-
40
-
41
-
42
-
43
-
44
-
45
-
46
-
47
-
48
-
49
-
50
-
51
-
52
-
53
-
54
-
55
-
56
-
57
-
58
-
59
-
60
-
 61
61 -
 62
62 -
 63
63 -
 64
64 -
 65
65 -
 66
66 -
 67
67 -
 68
68 -
 69
69 -
 70
70 -
 71
71 -
 72
72 -
 73
73 -
 74
74 -
 75
75 -
 76
76 -
 77
77 -
 78
78 -
 79
79 -
 80
80 -
 81
81 -
82
-
83
-
84
-
85
-
86
-
87
-
88
-
89
-
90
-
91
-
92
-
93
-
94
-
95
-
96
-
97
-
98
-
99
-
100
-
101
-
102
-
103
-
104
-
105
-
106
-
107
-
108
-
109
-
110
-
111
-
112
-
113
-
114
-
115
-
116
-
117
-
118
-
119
-
120
-
121
-
122
-
123
-
124
-
125
-
126
-
127
-
128
-
129
-
130
-
131
-
132
-
133
-
134
-
135
-
136
-
137
-
138
-
139
-
140
-
141
-
142
-
143
-
144
-
145
-
146
-
147
-
148
-
149
-
150
-
151
-
152
-
153
-
154
-
155
-
156
-
157
-
158
-
159
-
160
-
161
-
162
-
163
-
164
-
165
-
166
-
167
-
168
-
169
-
170
-
171
-
172
-
173
-
174
-
175
-
176
-
177
-
178
-
179
-
180
-
181
-
182
-
183
-
184
 |
 |

Table of Contents
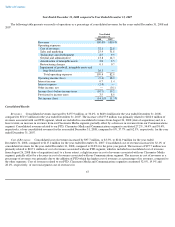
the year ended December 31, 2008, compared to 0%, 36.3% and 63.7%, respectively, for the year ended December 31, 2007.
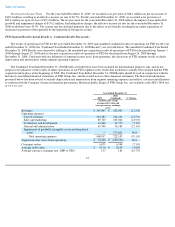
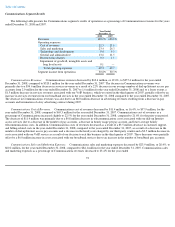
Sales and Marketing Expenses. Consolidated sales and marketing expenses increased by $9.6 million, or 5.9%, to $173.0 million, for the
year ended December 31, 2008, compared to $163.4 million for the year ended December 31, 2007. Consolidated sales and marketing expenses
as a percentage of consolidated revenues decreased to 25.9% for the year ended December 31, 2008, compared to 31.8% for the prior-year
period. The increase of $9.6 million was primarily related to $30.6 million of sales and marketing expenses associated with our FTD segment,
which are included in consolidated sales and marketing expenses from August 26, 2008 (date of acquisition) and, to a lesser extent, an increase
in sales and marketing expenses associated with our Classmates Media segment, partially offset by a decrease in expenses in the
Communications segment. The decrease as a percentage of consolidated revenues was primarily due to the addition of FTD, which has lower
sales and marketing expenses as a percentage its revenues, compared to the other segments. Sales and marketing expenses related to our FTD,
Classmates Media and Communications segments constituted 17.7%, 47.4% and 34.9%, respectively, of total segment sales and marketing
expenses for the year ended December 31, 2008, compared to 0%, 48.4% and 51.6%, respectively, for the year ended December 31, 2007.
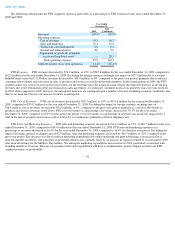
Technology and Development Expenses. Consolidated technology and development expenses increased by $5.7 million, or 11.1%, to
$56.7 million, for the year ended December 31, 2008, compared to $51.0 million for the year ended December 31, 2007. Consolidated
technology and development expenses as a percentage of consolidated revenues decreased to 8.5% for the year ended December 31, 2008,
compared to 9.9% for the prior-year period. The increase of $5.7 million was largely attributable to an increase in expenses in the Classmates
Media segment of $6.0 million, $3.7 million in expenses associated with our FTD segment, which are included in consolidated technology and
development expenses from August 26, 2008 (date of acquisition), and a $1.4 million increase in depreciation, partially offset by a decrease in
expenses in the Communications segment of $5.4 million. The decrease as a percentage of revenues was due to the addition of FTD, which has
lower technology and development expenses as a percentage of its revenues, compared to the other segments. Technology and development
expenses related to our FTD, Classmates Media and Communications segments constituted 7.4%, 44.0% and 48.6%, respectively, of total
segment technology and development expenses for the year ended December 31, 2008, compared to 0%, 35.1% and 64.9%, respectively, for the
year ended December 31, 2007.
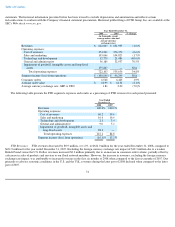
General and Administrative Expenses. Consolidated general and administrative expenses, in the aggregate, increased in the year ended
December 31, 2008 compared to the year ended December 31, 2007. A significant amount of the increase, in the aggregate, was due to the
addition of FTD and an increase in stock-based compensation as a result of several factors, including bonuses for certain members of senior
management for the year ended December 31, 2008 (the "2008 Bonuses") that were paid in shares of our common stock whereas such bonuses
were historically paid primarily in cash; the effect of shares of common stock and restricted stock units awarded in the first quarter of fiscal
2008; and the effect of restricted stock units awarded in 2007 to members of senior management in connection with the execution or renewal of
employment agreements. Also, the resignation of an executive officer in 2007 resulted in the reversal in 2007 of certain stock-based
compensation recorded in prior periods, which reduced stock-based compensation associated with general and administrative expenses in 2007.
The payment of the 2008 Bonuses in shares of common stock as opposed to cash, while increasing stock-based compensation, did not have a
significant impact on general and administrative expenses in 2008.
Consolidated general and administrative expenses increased by $18.9 million, or 25.8%, to $92.2 million, for the year ended December 31,
2008, compared to $73.3 million for the year ended
68