Classmates.com 2009 Annual Report Download - page 60
Download and view the complete annual report
Please find page 60 of the 2009 Classmates.com annual report below. You can navigate through the pages in the report by either clicking on the pages listed below, or by using the keyword search tool below to find specific information within the annual report.-
 1
1 -
2
-
3
-
4
-
5
-
6
-
7
-
8
-
9
-
10
-
11
-
12
-
13
-
14
-
15
-
16
-
17
-
18
-
19
-
20
-
21
-
22
-
23
-
24
-
25
-
26
-
27
-
28
-
29
-
30
-
31
-
32
-
33
-
34
-
35
-
36
-
37
-
38
-
39
-
40
-
41
-
42
-
43
-
44
-
45
-
46
-
47
-
48
-
49
-
 50
50 -
 51
51 -
 52
52 -
 53
53 -
 54
54 -
 55
55 -
 56
56 -
 57
57 -
 58
58 -
 59
59 -
 60
60 -
 61
61 -
 62
62 -
 63
63 -
 64
64 -
 65
65 -
 66
66 -
 67
67 -
 68
68 -
 69
69 -
 70
70 -
71
-
72
-
73
-
74
-
75
-
76
-
77
-
78
-
79
-
80
-
81
-
82
-
83
-
84
-
85
-
86
-
87
-
88
-
89
-
90
-
91
-
92
-
93
-
94
-
95
-
96
-
97
-
98
-
99
-
100
-
101
-
102
-
103
-
104
-
105
-
106
-
107
-
108
-
109
-
110
-
111
-
112
-
113
-
114
-
115
-
116
-
117
-
118
-
119
-
120
-
121
-
122
-
123
-
124
-
125
-
126
-
127
-
128
-
129
-
130
-
131
-
132
-
133
-
134
-
135
-
136
-
137
-
138
-
139
-
140
-
141
-
142
-
143
-
144
-
145
-
146
-
147
-
148
-
149
-
150
-
151
-
152
-
153
-
154
-
155
-
156
-
157
-
158
-
159
-
160
-
161
-
162
-
163
-
164
-
165
-
166
-
167
-
168
-
169
-
170
-
171
-
172
-
173
-
174
-
175
-
176
-
177
-
178
-
179
-
180
-
181
-
182
-
183
-
184
 |
 |

Table of Contents
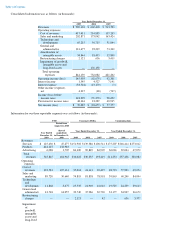
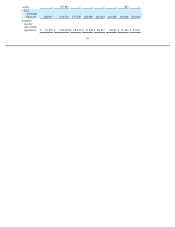
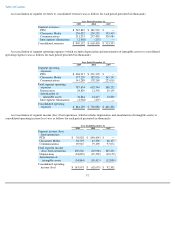
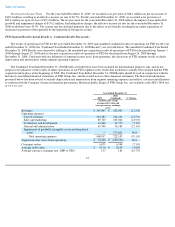
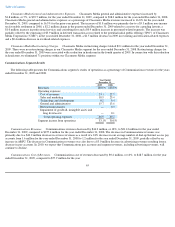
A reconciliation of segment revenues to consolidated revenues was as follows for each period presented (in thousands):
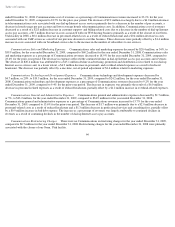
A reconciliation of segment operating expenses (which excludes depreciation and amortization of intangible assets) to consolidated
operating expenses was as follows for each period presented (in thousands):
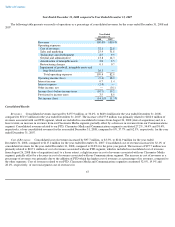
A reconciliation of segment income (loss) from operations (which excludes depreciation and amortization of intangible assets) to
consolidated operating income (loss) was as follows for each period presented (in thousands):
57
Year Ended December 31,
2009
2008
2007
Segment revenues:
FTD
$
545,845
$
181,965
$
—
Classmates Media
236,022
230,235
193,419
Communications
211,233
257,438
320,084
Intersegment eliminations
(2,968
)
(235
)
—
Consolidated revenues
$
990,132
$
669,403
$
513,503
Year Ended December 31,
2009
2008
2007
Segment operating
expenses:
FTD
$
468,917
$
331,370
$
—
Classmates Media
177,229
182,926
165,242
Communications
141,288
178,248
223,010
Total segment operating
expenses
787,434
692,544
388,252
Depreciation
24,829
21,358
20,150
Amortization of
intangible assets
34,844
18,415
12,800
Intersegment eliminations
(2,968
)
(235
)
—
Consolidated operating
expenses
$
844,139
$
732,082
$
421,202
Year Ended December 31,
2009
2008
2007
Segment income (loss)
from operations:
FTD
$
76,928
$
(149,405
)
$
—
Classmates Media
58,793
47,309
28,177
Communications
69,945
79,190
97,074
Total segment income
(loss) from operations
205,666
(22,906
)
125,251
Depreciation
(24,829
)
(21,358
)
(20,150
)
Amortization of
intangible assets
(34,844
)
(18,415
)
(12,800
)
Consolidated operating
income (loss)
$
145,993
$
(62,679
)
$
92,301