Classmates.com 2009 Annual Report Download - page 78
Download and view the complete annual report
Please find page 78 of the 2009 Classmates.com annual report below. You can navigate through the pages in the report by either clicking on the pages listed below, or by using the keyword search tool below to find specific information within the annual report.-
 1
1 -
2
-
3
-
4
-
5
-
6
-
7
-
8
-
9
-
10
-
11
-
12
-
13
-
14
-
15
-
16
-
17
-
18
-
19
-
20
-
21
-
22
-
23
-
24
-
25
-
26
-
27
-
28
-
29
-
30
-
31
-
32
-
33
-
34
-
35
-
36
-
37
-
38
-
39
-
40
-
41
-
42
-
43
-
44
-
45
-
46
-
47
-
48
-
49
-
50
-
51
-
52
-
53
-
54
-
55
-
56
-
57
-
58
-
59
-
60
-
61
-
62
-
63
-
64
-
65
-
66
-
67
-
 68
68 -
 69
69 -
 70
70 -
 71
71 -
 72
72 -
 73
73 -
 74
74 -
 75
75 -
 76
76 -
 77
77 -
 78
78 -
 79
79 -
 80
80 -
 81
81 -
 82
82 -
 83
83 -
 84
84 -
 85
85 -
 86
86 -
 87
87 -
 88
88 -
89
-
90
-
91
-
92
-
93
-
94
-
95
-
96
-
97
-
98
-
99
-
100
-
101
-
102
-
103
-
104
-
105
-
106
-
107
-
108
-
109
-
110
-
111
-
112
-
113
-
114
-
115
-
116
-
117
-
118
-
119
-
120
-
121
-
122
-
123
-
124
-
125
-
126
-
127
-
128
-
129
-
130
-
131
-
132
-
133
-
134
-
135
-
136
-
137
-
138
-
139
-
140
-
141
-
142
-
143
-
144
-
145
-
146
-
147
-
148
-
149
-
150
-
151
-
152
-
153
-
154
-
155
-
156
-
157
-
158
-
159
-
160
-
161
-
162
-
163
-
164
-
165
-
166
-
167
-
168
-
169
-
170
-
171
-
172
-
173
-
174
-
175
-
176
-
177
-
178
-
179
-
180
-
181
-
182
-
183
-
184
 |
 |

Table of Contents
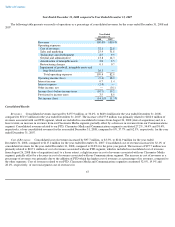
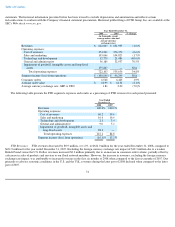
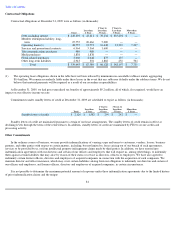
FTD Cost of Revenues. FTD cost of revenues decreased by $2.1 million, or 0.6%, to $374.2 million, for the year ended December 31,
2008, compared to $376.4 million for the year ended December 31, 2007. Excluding the impact of the strengthening of the U.S. Dollar versus the
British Pound of $8.4 million, cost of revenues increased by $6.3 million compared to the prior-year period. FTD cost of revenues as a
percentage of FTD revenues increased to 60.2% for the year ended December 31, 2008, compared to 59.6% for the prior-year period. Cost of
revenues as a percentage of revenues was impacted by a shift in the mix of products and services sold.
FTD Sales and Marketing Expenses. FTD sales and marketing expenses decreased by $1.8 million, or 1.7%, to $103.0 million, for the
year ended December 31, 2008, compared to $104.8 million for the year ended December 31, 2007. FTD sales and marketing expenses as a
percentage of FTD revenues remained consistent at 16.6% for the year ended December 31, 2008 and the prior-year period. Excluding the
impact of foreign currency exchange rates of $1.7 million, sales and marketing costs decreased by $0.1 million.
FTD Technology and Development Expenses. FTD technology and development expenses decreased by $8.7 million, or 40.6%, to
$12.8 million, for the year ended December 31, 2008, compared to $21.5 million, for the year ended December 31, 2007. FTD technology and
development expenses as a percentage of FTD revenues decreased to 2.1% for the year ended December 31, 2008, compared to 3.4% for the
prior-year period. Excluding the impact of foreign currency exchange rates of $0.6 million, technology and development costs decreased by
$8.1 million. The decrease was primarily driven by reduced costs for third-party services and personnel and related costs for technology
development.
FTD General and Administrative Expenses. FTD general and administrative expenses increased by $23.2 million, or 70.5%, to
$56.2 million, for the year ended December 31, 2008, compared to $33.0 million for the year ended December 31, 2007. FTD general and
administrative expenses as a percentage of FTD revenues increased to 9.0% for the year ended December 31, 2008, compared to 5.2% for the
prior-year period. Excluding the impact of foreign currency exchange rates, general and administrative costs increased by $23.5 million. The
increase was primarily due to the inclusion of $16.2 million of costs related to the acquisition of FTD in August 2008. In addition, FTD incurred
charges of $2.0 million related to acquisition opportunities that were abandoned in light of the pending acquisition. The increase related to these
costs was partially offset by reduced personnel and related costs and the reversal of a deferred compensation accrual upon the departure of a
member of FTD's management.
FTD Impairment of Goodwill, Intangible Assets and Long-Lived Assets. FTD impairment charges totaled $175.9 million for the year
ended December 31, 2008. There were no impairment charges for the year ended December 31, 2007. Impairment charges for the year ended
December 31, 2008 were due to a reduction in the fair value of the FTD reporting unit compared to its carrying value and lower fair values in the
FTD and Interflora trademarks and trade names compared to their carrying values.
Liquidity and Capital Resources
On August 26, 2008, we completed the acquisition of 100% of the capital stock of FTD Group, Inc. We paid a combination of (i) $10.15 in
cash and (ii) 0.4087 of a share of United Online common stock for each outstanding share of FTD common stock. The total merger consideration
was approximately $307 million in cash and approximately 12.3 million shares of United Online common stock, subject to the payment of cash
in lieu of fractional shares of United Online, Inc. common stock.
The FTD acquisition was funded, in part, with the net proceeds from (i) a $60 million term loan under a senior secured credit agreement
with Silicon Valley Bank (the "UOL Credit Agreement") and (ii) $375 million of term loan borrowings under senior secured credit facilities with
Wells Fargo Bank, National Association (the "FTD Credit Agreement"). In connection with the FTD Credit Agreement,
75