Classmates.com 2009 Annual Report Download - page 107
Download and view the complete annual report
Please find page 107 of the 2009 Classmates.com annual report below. You can navigate through the pages in the report by either clicking on the pages listed below, or by using the keyword search tool below to find specific information within the annual report.-
 1
1 -
2
-
3
-
4
-
5
-
6
-
7
-
8
-
9
-
10
-
11
-
12
-
13
-
14
-
15
-
16
-
17
-
18
-
19
-
20
-
21
-
22
-
23
-
24
-
25
-
26
-
27
-
28
-
29
-
30
-
31
-
32
-
33
-
34
-
35
-
36
-
37
-
38
-
39
-
40
-
41
-
42
-
43
-
44
-
45
-
46
-
47
-
48
-
49
-
50
-
51
-
52
-
53
-
54
-
55
-
56
-
57
-
58
-
59
-
60
-
61
-
62
-
63
-
64
-
65
-
66
-
67
-
68
-
69
-
70
-
71
-
72
-
73
-
74
-
75
-
76
-
77
-
78
-
79
-
80
-
81
-
82
-
83
-
84
-
85
-
86
-
87
-
88
-
89
-
90
-
91
-
92
-
93
-
94
-
95
-
96
-
 97
97 -
 98
98 -
 99
99 -
 100
100 -
 101
101 -
 102
102 -
 103
103 -
 104
104 -
 105
105 -
 106
106 -
 107
107 -
 108
108 -
 109
109 -
 110
110 -
 111
111 -
 112
112 -
 113
113 -
 114
114 -
 115
115 -
 116
116 -
 117
117 -
118
-
119
-
120
-
121
-
122
-
123
-
124
-
125
-
126
-
127
-
128
-
129
-
130
-
131
-
132
-
133
-
134
-
135
-
136
-
137
-
138
-
139
-
140
-
141
-
142
-
143
-
144
-
145
-
146
-
147
-
148
-
149
-
150
-
151
-
152
-
153
-
154
-
155
-
156
-
157
-
158
-
159
-
160
-
161
-
162
-
163
-
164
-
165
-
166
-
167
-
168
-
169
-
170
-
171
-
172
-
173
-
174
-
175
-
176
-
177
-
178
-
179
-
180
-
181
-
182
-
183
-
184
 |
 |

Table of Contents
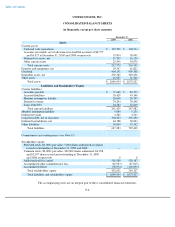
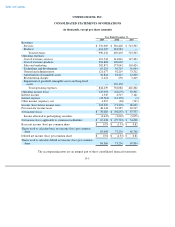
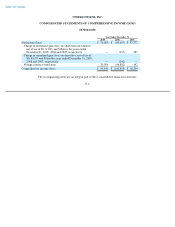
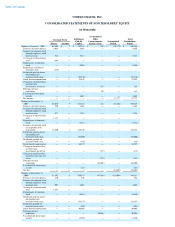
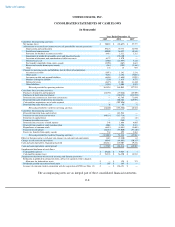
UNITED ONLINE, INC.
CONSOLIDATED STATEMENTS OF OPERATIONS
(in thousands, except per share amounts)
The accompanying notes are an integral part of these consolidated financial statements.
F-5
Year Ended December 31,
2009 2008 2007
Revenues:
Services
$
576,005
$
536,420
$
513,503
Products
414,127
132,983
—
Total revenues
990,132
669,403
513,503
Operating expenses:
Cost of revenues
-
services
112,543
114,816
117,203
Cost of revenues
-
products
304,868
100,069
—
Sales and marketing
202,871
173,042
163,424
Technology and development
65,215
56,715
51,044
General and administrative
121,677
92,219
73,312
Amortization of intangible assets
34,844
18,415
12,800
Restructuring charges
2,121
656
3,419
Impairment of goodwill, intangible assets and long
-
lived
assets
—
176,150
—
Total operating expenses
844,139
732,082
421,202
Operating income (loss)
145,993
(62,679
)
92,301
Interest income
1,545
4,527
7,141
Interest expense
(33,524
)
(13,170
)
(3
)
Other income (expense), net
4,215
(48
)
(747
)
Income (loss) before income taxes
118,229
(71,370
)
98,692
Provision for income taxes
48,144
23,287
40,915
Net income (loss)
$
70,085
$
(94,657
)
$
57,777
Income allocated to participating securities
(4,647
)
(3,065
)
(3,079
)
Net income (loss) applicable to common stockholders
$
65,438
$
(97,722
)
$
54,698
Basic net income (loss) per common share
$
0.78
$
(1.33
)
$
0.82
Shares used to calculate basic net income (loss) per common
share
83,698
73,236
66,768
Diluted net income (loss) per common share
$
0.78
$
(1.33
)
$
0.81
Shares used to calculate diluted net income (loss) per common
share
84,386
73,236
67,834