Classmates.com 2009 Annual Report Download - page 75
Download and view the complete annual report
Please find page 75 of the 2009 Classmates.com annual report below. You can navigate through the pages in the report by either clicking on the pages listed below, or by using the keyword search tool below to find specific information within the annual report.-
 1
1 -
2
-
3
-
4
-
5
-
6
-
7
-
8
-
9
-
10
-
11
-
12
-
13
-
14
-
15
-
16
-
17
-
18
-
19
-
20
-
21
-
22
-
23
-
24
-
25
-
26
-
27
-
28
-
29
-
30
-
31
-
32
-
33
-
34
-
35
-
36
-
37
-
38
-
39
-
40
-
41
-
42
-
43
-
44
-
45
-
46
-
47
-
48
-
49
-
50
-
51
-
52
-
53
-
54
-
55
-
56
-
57
-
58
-
59
-
60
-
61
-
62
-
63
-
64
-
 65
65 -
 66
66 -
 67
67 -
 68
68 -
 69
69 -
 70
70 -
 71
71 -
 72
72 -
 73
73 -
 74
74 -
 75
75 -
 76
76 -
 77
77 -
 78
78 -
 79
79 -
 80
80 -
 81
81 -
 82
82 -
 83
83 -
 84
84 -
 85
85 -
86
-
87
-
88
-
89
-
90
-
91
-
92
-
93
-
94
-
95
-
96
-
97
-
98
-
99
-
100
-
101
-
102
-
103
-
104
-
105
-
106
-
107
-
108
-
109
-
110
-
111
-
112
-
113
-
114
-
115
-
116
-
117
-
118
-
119
-
120
-
121
-
122
-
123
-
124
-
125
-
126
-
127
-
128
-
129
-
130
-
131
-
132
-
133
-
134
-
135
-
136
-
137
-
138
-
139
-
140
-
141
-
142
-
143
-
144
-
145
-
146
-
147
-
148
-
149
-
150
-
151
-
152
-
153
-
154
-
155
-
156
-
157
-
158
-
159
-
160
-
161
-
162
-
163
-
164
-
165
-
166
-
167
-
168
-
169
-
170
-
171
-
172
-
173
-
174
-
175
-
176
-
177
-
178
-
179
-
180
-
181
-
182
-
183
-
184
 |
 |

Table of Contents
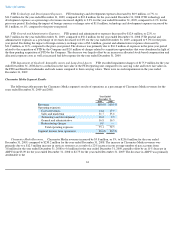
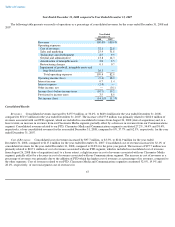
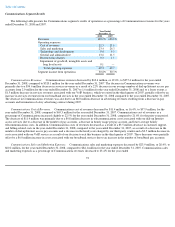
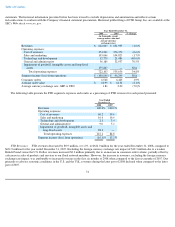
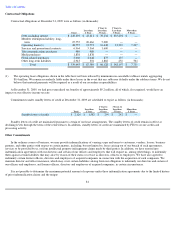
Communications Segment Results
The following table presents the Communications segment's results of operations as a percentage of Communications revenues for the years
ended December 31, 2008 and 2007.
Communications Revenues. Communications revenues decreased by $62.6 million, or 19.6%, to $257.4 million for the year ended
December 31, 2008, compared to $320.1 million for the year ended December 31, 2007. The decrease in Communications revenues was
primarily due to a $54.6 million decrease in services revenues as a result of a 22% decrease in our average number of dial-up Internet access pay
accounts from 2.0 million for the year ended December 31, 2007 to 1.6 million for the year ended December 31, 2008 and, to a lesser extent, a
$1.5 million decrease in services revenues associated with our VoIP business, which we exited in the third quarter of 2007, partially offset by an
increase in services revenues from our broadband services in the year ended December 31, 2008 compared to the year ended December 31, 2007.
The decrease in Communications revenues was also due to an $8.0 million decrease in advertising revenues resulting from a decrease in pay
accounts and termination of a key advertising contract during 2007.
Communications Cost of Revenues. Communications cost of revenues decreased by $11.4 million, or 16.4%, to $57.9 million, for the
year ended December 31, 2008, compared to $69.3 million for the year ended December 31, 2007. Communications cost of revenues as a
percentage of Communications increased slightly to 22.5% for the year ended December 31, 2008, compared to 21.6% for the prior-year period.
The decrease of $11.4 million was primarily due to a $9.8 million decrease in telecommunications costs associated with our dial-up Internet
access services due to a decrease in the number of pay accounts, a decrease in hourly usage per pay account, and lower average hourly
telecommunications costs. In addition, Communications costs of revenues decreased as a result of a $3.5 million decrease in customer support-
and billing-related costs in the year ended December 31, 2008, compared to the year ended December 31, 2007, as a result of a decrease in the
number of dial-up Internet access pay accounts and a decrease in the hourly rate charged by our third-
party vendor and a $2.5 million decrease in
costs associated with our VoIP service as a result of our decision to exit this business in the third quarter of 2007. These decreases were partially
offset by a $6.0 million increase in costs associated with our broadband services due to an increase in the number of broadband pay accounts.
Communications Sales and Marketing Expenses.
Communications sales and marketing expenses decreased by $23.9 million, or 28.4%, to
$60.2 million, for the year ended December 31, 2008, compared to $84.1 million for the year ended December 31, 2007. Communications sales
and marketing expenses as a percentage of Communications revenues decreased to 23.4% for the year ended
72
Year Ended
December 31,
2008
2007
Revenues
100.0
%
100.0
%
Operating expenses:
Cost of revenues
22.5
21.6
Sales and marketing
23.4
26.3
Technology and development
9.4
9.3
General and administrative
13.6
11.5
Restructuring charges
0.3
1.1
Impairment of goodwill, intangible assets and
long lived assets
0.1
—
Total operating expenses
69.2
69.7
Segment income from operations
30.8
%
30.3
%