Classmates.com 2009 Annual Report Download - page 80
Download and view the complete annual report
Please find page 80 of the 2009 Classmates.com annual report below. You can navigate through the pages in the report by either clicking on the pages listed below, or by using the keyword search tool below to find specific information within the annual report.-
 1
1 -
2
-
3
-
4
-
5
-
6
-
7
-
8
-
9
-
10
-
11
-
12
-
13
-
14
-
15
-
16
-
17
-
18
-
19
-
20
-
21
-
22
-
23
-
24
-
25
-
26
-
27
-
28
-
29
-
30
-
31
-
32
-
33
-
34
-
35
-
36
-
37
-
38
-
39
-
40
-
41
-
42
-
43
-
44
-
45
-
46
-
47
-
48
-
49
-
50
-
51
-
52
-
53
-
54
-
55
-
56
-
57
-
58
-
59
-
60
-
61
-
62
-
63
-
64
-
65
-
66
-
67
-
68
-
69
-
 70
70 -
 71
71 -
 72
72 -
 73
73 -
 74
74 -
 75
75 -
 76
76 -
 77
77 -
 78
78 -
 79
79 -
 80
80 -
 81
81 -
 82
82 -
 83
83 -
 84
84 -
 85
85 -
 86
86 -
 87
87 -
 88
88 -
 89
89 -
 90
90 -
91
-
92
-
93
-
94
-
95
-
96
-
97
-
98
-
99
-
100
-
101
-
102
-
103
-
104
-
105
-
106
-
107
-
108
-
109
-
110
-
111
-
112
-
113
-
114
-
115
-
116
-
117
-
118
-
119
-
120
-
121
-
122
-
123
-
124
-
125
-
126
-
127
-
128
-
129
-
130
-
131
-
132
-
133
-
134
-
135
-
136
-
137
-
138
-
139
-
140
-
141
-
142
-
143
-
144
-
145
-
146
-
147
-
148
-
149
-
150
-
151
-
152
-
153
-
154
-
155
-
156
-
157
-
158
-
159
-
160
-
161
-
162
-
163
-
164
-
165
-
166
-
167
-
168
-
169
-
170
-
171
-
172
-
173
-
174
-
175
-
176
-
177
-
178
-
179
-
180
-
181
-
182
-
183
-
184
 |
 |

Table of Contents
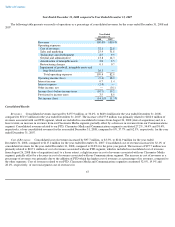
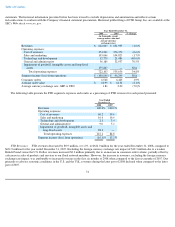
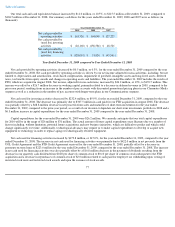
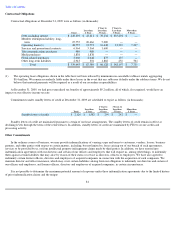
Our total cash and cash equivalents balance increased by $11.0 million, or 10.5%, to $115.5 million at December 31, 2009, compared to
$104.5 million at December 31, 2008. Our summary cash flows for the years ended December 31, 2009, 2008 and 2007 were as follows (in
thousands):
Year Ended December 31, 2009 compared to Year Ended December 31, 2008
Net cash provided by operating activities decreased by $0.5 million, or 0.3%, for the year ended December 31, 2009 compared to the year
ended December 31, 2008. Net cash provided by operating activities is driven by our net income adjusted for non-cash items, including, but not
limited to, depreciation and amortization, stock-based compensation, impairment of goodwill, intangible assets and long-lived assets, deferred
taxes, tax benefits from equity awards and changes in operating assets and liabilities. The year ended December 31, 2009 includes the results of
FTD, which we acquired in August 2008. Net income, adjusted for non-cash items, increased by $26.2 million, or 19%, to $170.5 million. This
increase was offset by a $26.7 million decrease in working capital, primarily related to a decrease in deferred revenue in 2009, compared to the
prior-year period, resulting from an increase in the number of pay accounts with discounted promotional pricing plans in our Classmates Media
segment as well as a reduction in the number of pay accounts with longer-term plans in our Communications segment.
Net cash used for investing activities decreased by $232.4 million, or 89.9%, for the year ended December 31, 2009, compared to the year
ended December 31, 2008. The decrease was primarily due to $307.5 million in cash paid for our FTD acquisition in August 2008. The decrease
was partially offset by a $68.8 million decrease in net proceeds from sales and maturities of short-term investments for the year ended
December 31, 2009, compared to the prior-year period, as a result of our decision to liquidate our short-term investments portfolio in 2008 and a
$6.3 million increase in capital expenditures for the year ended December 31, 2009 compared to the year ended December 31, 2008.
Capital expenditures for the year ended December 31, 2009 were $26.2 million. We currently anticipate that our total capital expenditures
for 2010 will be in the range of $26 million to $31 million. The actual amount of future capital expenditures may fluctuate due to a number of
factors including, without limitation, potential future acquisitions and new business initiatives, which are difficult to predict and which could
change significantly over time. Additionally, technological advances may require us to make capital expenditures to develop or acquire new
equipment or technology in order to replace aging or technologically obsolete equipment.
Net cash used for financing activities increased by $179.8 million, or 347.0%, for the year ended December 31, 2009, compared to the year
ended December 31, 2008. The increase in net cash used for financing activities was primarily due to $422.0 million in net proceeds from the
UOL Credit Agreement and the FTD Credit Agreement received for the year ended December 31, 2008, partially offset by a decrease in
payments on term loans of $223.6 million for the year ended December 31, 2009, compared to the year ended December 31, 2008. The increase
in net cash used for financing activities was also partially offset by a $16.8 million decrease in the payment of dividends resulting from the
decrease in our quarterly cash dividend from $0.20 per share of common stock to $0.10 per share of common stock subsequent to the FTD
acquisition and a decrease in repurchases of common stock of $2.0 million related to cash paid for employee tax withholding upon vesting of
restricted stock units and restricted stock awards and upon the issuance of stock awards.
77
Year Ended December 31,
2009 2008 2007
Net cash provided by
operating activities
$
163,526
$
164,049
$
127,225
Net cash provided by
(used for) investing
activities
$
(26,160
)
$
(258,586
)
$
48,526
Net cash provided by
(used for) financing
activities
$
(128,019
)
$
51,824
$
(45,561
)