Classmates.com 2009 Annual Report Download - page 65
Download and view the complete annual report
Please find page 65 of the 2009 Classmates.com annual report below. You can navigate through the pages in the report by either clicking on the pages listed below, or by using the keyword search tool below to find specific information within the annual report.-
 1
1 -
2
-
3
-
4
-
5
-
6
-
7
-
8
-
9
-
10
-
11
-
12
-
13
-
14
-
15
-
16
-
17
-
18
-
19
-
20
-
21
-
22
-
23
-
24
-
25
-
26
-
27
-
28
-
29
-
30
-
31
-
32
-
33
-
34
-
35
-
36
-
37
-
38
-
39
-
40
-
41
-
42
-
43
-
44
-
45
-
46
-
47
-
48
-
49
-
50
-
51
-
52
-
53
-
54
-
 55
55 -
 56
56 -
 57
57 -
 58
58 -
 59
59 -
 60
60 -
 61
61 -
 62
62 -
 63
63 -
 64
64 -
 65
65 -
 66
66 -
 67
67 -
 68
68 -
 69
69 -
 70
70 -
 71
71 -
 72
72 -
 73
73 -
 74
74 -
 75
75 -
76
-
77
-
78
-
79
-
80
-
81
-
82
-
83
-
84
-
85
-
86
-
87
-
88
-
89
-
90
-
91
-
92
-
93
-
94
-
95
-
96
-
97
-
98
-
99
-
100
-
101
-
102
-
103
-
104
-
105
-
106
-
107
-
108
-
109
-
110
-
111
-
112
-
113
-
114
-
115
-
116
-
117
-
118
-
119
-
120
-
121
-
122
-
123
-
124
-
125
-
126
-
127
-
128
-
129
-
130
-
131
-
132
-
133
-
134
-
135
-
136
-
137
-
138
-
139
-
140
-
141
-
142
-
143
-
144
-
145
-
146
-
147
-
148
-
149
-
150
-
151
-
152
-
153
-
154
-
155
-
156
-
157
-
158
-
159
-
160
-
161
-
162
-
163
-
164
-
165
-
166
-
167
-
168
-
169
-
170
-
171
-
172
-
173
-
174
-
175
-
176
-
177
-
178
-
179
-
180
-
181
-
182
-
183
-
184
 |
 |

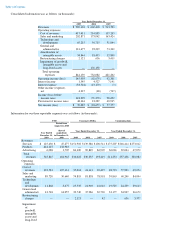
Table of Contents
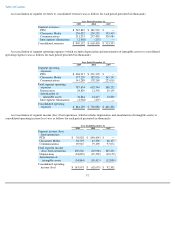
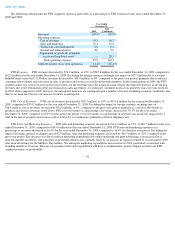
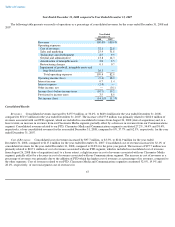
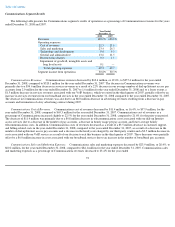
The following table presents the FTD segment's expenses and results as a percentage of FTD revenues for the years ended December 31,
2009 and 2008.
FTD Revenues.
FTD revenues decreased by $76.2 million, or 12%, to $545.8 million for the year ended December 31, 2009, compared to
$622.0 million for the year ended December 31, 2008. Excluding the foreign currency exchange rate impact of $27.3 million due to a weaker
British Pound versus the U.S. Dollar, revenues decreased by $48.9 million, or 8%, compared to the prior-year period, primarily due to reduced
consumer order volume and a decrease in sales of products and services to our floral network members. In the fourth quarter of 2009, the FTD
segment achieved a year-over-year increase in revenues for the first time since the acquisition and, despite the expected decrease in advertising
revenues due to the termination of the post-transaction sales agreements, we anticipate continued increases in quarterly year-over-year revenues
in 2010 when compared to 2009; however, the anticipated increases are contingent upon a number of factors, including economic conditions, and
there is no assurance that we can increase revenues as anticipated.
FTD Cost of Revenues. FTD cost of revenues decreased by $50.7 million, or 14%, to $323.6 million for the year ended December 31,
2009, compared to $374.2 million for the year ended December 31, 2008. Excluding the impact of foreign currency exchange rates of
$18.8 million, cost of revenues decreased by $31.8 million, or 9%, compared to the prior-year period, primarily as a result of the decline in
products and services revenues noted above. FTD cost of revenues as a percentage of revenues decreased to 59.3% for the year ended
December 31, 2009, compared to 60.2% for the prior-year period. Cost of revenues as a percentage of revenues was positively impacted by a
shift in the mix of products and services sold as well as by cost reductions, primarily related to shipping costs.
FTD Sales and Marketing Expenses.
FTD sales and marketing expenses decreased by $13.3 million, or 13%, to $89.7 million for the year
ended December 31, 2009, compared to $103.0 million for the year ended December 31, 2008. FTD sales and marketing expenses as a
percentage of revenues decreased to 16.4% for the year ended December 31, 2009, compared to 16.6% for the prior-year period. Excluding the
impact of foreign currency exchange rates of $2.8 million, sales and marketing expenses decreased by $10.5 million, or 10%, compared to the
prior-year period. The decrease was due to reduced marketing expenditures for online marketing and print advertising, a decrease in floral
network member incentives, and a decrease in personnel-related costs, partially offset by an increase in expenses related to second quarter 2009
television advertising for the Mother's Day holiday. We anticipate marketing expenditures may increase in 2010, particularly associated with
branding initiatives; however, there are no assurances that such expenditures will have a commensurate, positive impact on either our FTD
segment revenues or profitability.
62
Year Ended
December 31,
2009
2008
(Combined)
Revenues
100.0
%
100.0
%
Operating expenses:
Cost of revenues
59.3
60.2
Sales and marketing
16.4
16.6
Technology and development
2.2
2.1
General and administrative
8.0
9.0
Impairment of goodwill, intangible
assets and long
-
lived assets
—
28.3
Total operating expenses
85.9
116.1
Segment income (loss) from operations
14.1
%
(16.1
)%