Classmates.com 2009 Annual Report Download - page 47
Download and view the complete annual report
Please find page 47 of the 2009 Classmates.com annual report below. You can navigate through the pages in the report by either clicking on the pages listed below, or by using the keyword search tool below to find specific information within the annual report.-
 1
1 -
2
-
3
-
4
-
5
-
6
-
7
-
8
-
9
-
10
-
11
-
12
-
13
-
14
-
15
-
16
-
17
-
18
-
19
-
20
-
21
-
22
-
23
-
24
-
25
-
26
-
27
-
28
-
29
-
30
-
31
-
32
-
33
-
34
-
35
-
36
-
 37
37 -
 38
38 -
 39
39 -
 40
40 -
 41
41 -
 42
42 -
 43
43 -
 44
44 -
 45
45 -
 46
46 -
 47
47 -
 48
48 -
 49
49 -
 50
50 -
 51
51 -
 52
52 -
 53
53 -
 54
54 -
 55
55 -
 56
56 -
 57
57 -
58
-
59
-
60
-
61
-
62
-
63
-
64
-
65
-
66
-
67
-
68
-
69
-
70
-
71
-
72
-
73
-
74
-
75
-
76
-
77
-
78
-
79
-
80
-
81
-
82
-
83
-
84
-
85
-
86
-
87
-
88
-
89
-
90
-
91
-
92
-
93
-
94
-
95
-
96
-
97
-
98
-
99
-
100
-
101
-
102
-
103
-
104
-
105
-
106
-
107
-
108
-
109
-
110
-
111
-
112
-
113
-
114
-
115
-
116
-
117
-
118
-
119
-
120
-
121
-
122
-
123
-
124
-
125
-
126
-
127
-
128
-
129
-
130
-
131
-
132
-
133
-
134
-
135
-
136
-
137
-
138
-
139
-
140
-
141
-
142
-
143
-
144
-
145
-
146
-
147
-
148
-
149
-
150
-
151
-
152
-
153
-
154
-
155
-
156
-
157
-
158
-
159
-
160
-
161
-
162
-
163
-
164
-
165
-
166
-
167
-
168
-
169
-
170
-
171
-
172
-
173
-
174
-
175
-
176
-
177
-
178
-
179
-
180
-
181
-
182
-
183
-
184
 |
 |

Table of Contents
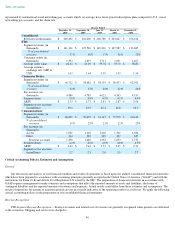
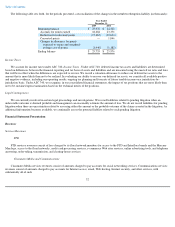
represented by international social networking pay accounts which, on average, have lower-priced subscription plans compared to U.S. social
networking pay accounts, and the churn rate.
Critical Accounting Policies, Estimates and Assumptions
General
Our discussion and analysis of our financial condition and results of operations is based upon our audited consolidated financial statements,
which have been prepared in accordance with accounting principles generally accepted in the United States of America ("GAAP") and with the
instructions for Form 10-K and Article 10 of Regulation S-X issued by the SEC. The preparation of financial statements in accordance with
GAAP requires management to make estimates and assumptions that affect the reported amounts of assets and liabilities, disclosure of
contingent liabilities and the reported amounts of revenues and expenses. Actual results could differ from those estimates and assumptions. The
results of operations for interim or transition periods are not necessarily indicative of the operating results for a full year. We apply the following
critical accounting policies in the preparation of our consolidated financial statements:
Revenue Recognition
FTD Segment Revenue Recognition —Products revenues and related cost of revenues are generally recognized when products are delivered
to the customers. Shipping and service fees charged to
46
Quarter Ended
December 31,
2009 September 30,
2009 June 30,
2009 March 31,
2009 December 31,
2008
Consolidated:
Revenues (in thousands)
$
249,490
$
216,206
$
260,789
$
263,647
$
256,162
FTD:
Segment revenues (in
thousands)
$
141,116
$
107,526
$
149,216
$
147,987
$
133,685
% of consolidated
revenues
57
%
50
%
57
%
56
%
52
%
Consumer orders (in
thousands)
1,594
1,075
1,711
1,691
1,467
Average order value
$
60.14
$
61.29
$
59.78
$
57.70
$
58.80
Average currency
exchange rate: GBP to
USD
1.63
1.64
1.55
1.43
1.56
Classmates Media:
Segment revenues (in
thousands)
$
60,712
$
58,682
$
58,155
$
58,473
$
62,592
% of consolidated
revenues
24
%
27
%
22
%
22
%
24
%
Pay accounts (in
thousands)
4,886
4,785
4,621
4,563
4,319
Segment churn
3.8
%
3.8
%
4.3
%
4.1
%
4.4
%
ARPU
$
2.53
$
2.71
$
2.81
$
2.87
$
2.98
Segment active accounts
(in millions)
19.4
16.9
16.4
16.8
16.0
Communications:
Segment revenues (in
thousands)
$
48,429
$
50,679
$
54,147
$
57,978
$
60,120
% of consolidated
revenues
19
%
23
%
21
%
22
%
23
%
Pay accounts (in
thousands):
Access
1,036
1,118
1,203
1,316
1,388
Other
314
322
329
337
347
Total pay accounts
1,350
1,440
1,532
1,653
1,735
Segment churn
4.4
%
4.6
%
4.9
%
4.8
%
4.3
%
ARPU
$
9.43
$
9.43
$
9.55
$
9.45
$
9.31
Segment active accounts
(in millions)
2.2
2.3
2.4
2.6
2.7