Classmates.com 2009 Annual Report Download - page 58
Download and view the complete annual report
Please find page 58 of the 2009 Classmates.com annual report below. You can navigate through the pages in the report by either clicking on the pages listed below, or by using the keyword search tool below to find specific information within the annual report.-
 1
1 -
2
-
3
-
4
-
5
-
6
-
7
-
8
-
9
-
10
-
11
-
12
-
13
-
14
-
15
-
16
-
17
-
18
-
19
-
20
-
21
-
22
-
23
-
24
-
25
-
26
-
27
-
28
-
29
-
30
-
31
-
32
-
33
-
34
-
35
-
36
-
37
-
38
-
39
-
40
-
41
-
42
-
43
-
44
-
45
-
46
-
47
-
 48
48 -
 49
49 -
 50
50 -
 51
51 -
 52
52 -
 53
53 -
 54
54 -
 55
55 -
 56
56 -
 57
57 -
 58
58 -
 59
59 -
 60
60 -
 61
61 -
 62
62 -
 63
63 -
 64
64 -
 65
65 -
 66
66 -
 67
67 -
 68
68 -
69
-
70
-
71
-
72
-
73
-
74
-
75
-
76
-
77
-
78
-
79
-
80
-
81
-
82
-
83
-
84
-
85
-
86
-
87
-
88
-
89
-
90
-
91
-
92
-
93
-
94
-
95
-
96
-
97
-
98
-
99
-
100
-
101
-
102
-
103
-
104
-
105
-
106
-
107
-
108
-
109
-
110
-
111
-
112
-
113
-
114
-
115
-
116
-
117
-
118
-
119
-
120
-
121
-
122
-
123
-
124
-
125
-
126
-
127
-
128
-
129
-
130
-
131
-
132
-
133
-
134
-
135
-
136
-
137
-
138
-
139
-
140
-
141
-
142
-
143
-
144
-
145
-
146
-
147
-
148
-
149
-
150
-
151
-
152
-
153
-
154
-
155
-
156
-
157
-
158
-
159
-
160
-
161
-
162
-
163
-
164
-
165
-
166
-
167
-
168
-
169
-
170
-
171
-
172
-
173
-
174
-
175
-
176
-
177
-
178
-
179
-
180
-
181
-
182
-
183
-
184
 |
 |

Table of Contents
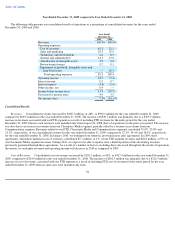
Consolidated information was as follows (in thousands):
Information for our three reportable segments was as follows (in thousands):
Year Ended December 31,
2009
2008
2007
Revenues
$
990,132
$
669,403
$
513,503
Operating expenses:
Cost of revenues
417,411
214,885
117,203
Sales and marketing
202,871
173,042
163,424
Technology and
development
65,215
56,715
51,044
General and
administrative
121,677
92,219
73,312
Amortization of
intangible assets
34,844
18,415
12,800
Restructuring charges
2,121
656
3,419
Impairment of goodwill,
intangible assets and
long
-
lived assets
—
176,150
—
Total operating
expenses
844,139
732,082
421,202
Operating income (loss)
145,993
(62,679
)
92,301
Interest income
1,545
4,527
7,141
Interest expense
(33,524
)
(13,170
)
(3
)
Other income (expense),
net
4,215
(48
)
(747
)
Income (loss) before
income taxes
118,229
(71,370
)
98,692
Provision for income taxes
48,144
23,287
40,915
Net income (loss)
$
70,085
$
(94,657
)
$
57,777
FTD
Classmates Media
Communications
Period from
August 26, 2008
(date of
acquisition)
to December 31,
2008
Year Ended December 31,
Year Ended December 31,
Year Ended
December 31,
2009
2009
2008
2007
2009
2008
2007
Revenues:
Services
$
125,430
$
47,277
$
151,902
$
139,386
$
106,514
$
175,207
$
218,414
$
273,012
Products
414,127
132,983
—
—
—
—
—
—
Advertising
6,288
1,705
84,120
90,849
86,905
36,026
39,024
47,072
Total
revenues
545,845
181,965
236,022
230,235
193,419
211,233
257,438
320,084
Operating
expenses:
Cost of
revenues
323,581
107,131
35,014
41,113
39,497
48,723
57,903
69,254
Sales and
marketing
89,720
30,640
74,819
81,858
78,918
39,863
60,240
84,094
Technology
and
development
11,868
3,677
25,535
21,969
16,016
19,525
24,239
29,613
General and
administrative
43,748
14,055
39,740
37,986
30,769
33,177
34,927
36,672
Restructuring
charges
—
—
2,121
—
42
—
656
3,377
Impairment
of
goodwill,
intangible
assets and
long
-
lived