Classmates.com 2009 Annual Report Download - page 76
Download and view the complete annual report
Please find page 76 of the 2009 Classmates.com annual report below. You can navigate through the pages in the report by either clicking on the pages listed below, or by using the keyword search tool below to find specific information within the annual report.-
 1
1 -
2
-
3
-
4
-
5
-
6
-
7
-
8
-
9
-
10
-
11
-
12
-
13
-
14
-
15
-
16
-
17
-
18
-
19
-
20
-
21
-
22
-
23
-
24
-
25
-
26
-
27
-
28
-
29
-
30
-
31
-
32
-
33
-
34
-
35
-
36
-
37
-
38
-
39
-
40
-
41
-
42
-
43
-
44
-
45
-
46
-
47
-
48
-
49
-
50
-
51
-
52
-
53
-
54
-
55
-
56
-
57
-
58
-
59
-
60
-
61
-
62
-
63
-
64
-
65
-
 66
66 -
 67
67 -
 68
68 -
 69
69 -
 70
70 -
 71
71 -
 72
72 -
 73
73 -
 74
74 -
 75
75 -
 76
76 -
 77
77 -
 78
78 -
 79
79 -
 80
80 -
 81
81 -
 82
82 -
 83
83 -
 84
84 -
 85
85 -
 86
86 -
87
-
88
-
89
-
90
-
91
-
92
-
93
-
94
-
95
-
96
-
97
-
98
-
99
-
100
-
101
-
102
-
103
-
104
-
105
-
106
-
107
-
108
-
109
-
110
-
111
-
112
-
113
-
114
-
115
-
116
-
117
-
118
-
119
-
120
-
121
-
122
-
123
-
124
-
125
-
126
-
127
-
128
-
129
-
130
-
131
-
132
-
133
-
134
-
135
-
136
-
137
-
138
-
139
-
140
-
141
-
142
-
143
-
144
-
145
-
146
-
147
-
148
-
149
-
150
-
151
-
152
-
153
-
154
-
155
-
156
-
157
-
158
-
159
-
160
-
161
-
162
-
163
-
164
-
165
-
166
-
167
-
168
-
169
-
170
-
171
-
172
-
173
-
174
-
175
-
176
-
177
-
178
-
179
-
180
-
181
-
182
-
183
-
184
 |
 |

Table of Contents
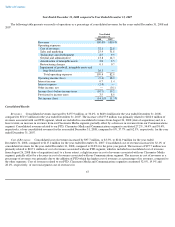
December 31, 2008, compared to 26.3% for the prior-year period. The decrease in expenses was a result of continued declines in dial-
up Internet
access revenues. The decrease of $23.9 million was attributable to a $21.6 million decline in advertising, promotion and distribution costs related
to our dial-up Internet access services, a $1.3 million decrease in promotion costs related to our broadband services, and a $0.7 million decrease
in personnel- and overhead-related expenses as a result of reduced headcount.
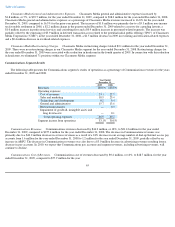
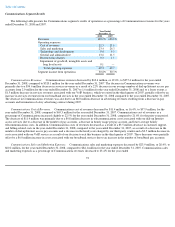
Communications Technology and Development Expenses. Communications technology and development expenses decreased by
$5.4 million, or 18.1%, to $24.2 million, for the year ended December 31, 2008, compared to $29.6 million, for the year ended December 31,
2007. Communications technology and development expenses as a percentage of Communications revenues remained stable at 9.4% for the year
ended December 31, 2008, compared to 9.3% for the prior-year period. The decrease in expense was primarily the result of a $5.5 million
decrease in personnel-related expenses as a result of reduced headcount.
Communications General and Administrative Expenses.
Communications general and administrative expenses decreased by $1.7 million,
or 4.6%, to $34.9 million, for the year ended December 31, 2008, compared to $36.7 million for the year ended December 31, 2007.
Communications general and administrative expenses as a percentage of Communications revenues increased to 13.6% for the year ended
December 31, 2008, compared to 11.5% for the prior-year period. The decrease of $1.7 million was due to a combined $2.4 million decrease in
bad debt expense related to a technology partner and a litigation-related allowance recorded in the quarter ended September 30, 2007, a
$2.0 million decrease in facilities and other overhead-related expenses, and a $0.6 million decrease in recruiting and relocation expenses. These
decreases were partially offset by a $2.2 million increase in personnel-related expenses and, a $1.2 million increase in consulting fees. The
increase as a percentage of revenues was largely attributable to continued declines in revenues as a result of continuing declines in the number of
dial-up Internet access pay accounts.
Communications Restructuring Charges. Communications restructuring charges totaled $0.7 million for the year ended December 31,
2008, compared to $3.4 million for the year ended December 31, 2007. The restructuring charges for the year ended December 31, 2008 were
primarily associated with the closure of our Orem, Utah facility. In 2007, we eliminated 69 positions and recorded restructuring charges totaling
$3.0 million to better align the segment's cost structure within a mature business for dial-up Internet access services. In addition, we recognized
$0.4 million in restructuring charges in the year ended December 31, 2007 for termination benefits paid to certain employees associated with our
Web hosting and photo sharing businesses.
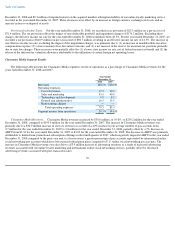
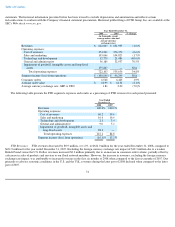
FTD Segment Results (Combined Results vs. Pre-Acquisition Results Discussion)
The unaudited combined results of operations for FTD for the year ended December 31, 2008 and unaudited pre-acquisition results of
operations for FTD for the year ended December 31, 2007 are set forth below. The unaudited combined results of operations of FTD for the year
ended December 31, 2008 were derived by adding (i) the unaudited pre-acquisition results of operations of FTD for the period from January 1,
2008 through August 25, 2008 and (ii) the audited post-acquisition results of operations of FTD for the period from August 26, 2008 through
December 31, 2008. Consistent with our definition of segment income from operations, the discussion of FTD segment results excludes
depreciation and amortization within segment operating expenses.
The unaudited results of operations of FTD set forth below have been included for informational purposes only and do not purport to be
indicative of the results of future operations of the FTD segment or the results that would have actually been attained had the acquisition taken
place at the beginning of 2008. The pre-acquisition results of FTD should be read in conjunction with the historical consolidated financial
statements of FTD Group, Inc. and the related notes to those financial
73