Classmates.com 2009 Annual Report Download - page 66
Download and view the complete annual report
Please find page 66 of the 2009 Classmates.com annual report below. You can navigate through the pages in the report by either clicking on the pages listed below, or by using the keyword search tool below to find specific information within the annual report.-
 1
1 -
2
-
3
-
4
-
5
-
6
-
7
-
8
-
9
-
10
-
11
-
12
-
13
-
14
-
15
-
16
-
17
-
18
-
19
-
20
-
21
-
22
-
23
-
24
-
25
-
26
-
27
-
28
-
29
-
30
-
31
-
32
-
33
-
34
-
35
-
36
-
37
-
38
-
39
-
40
-
41
-
42
-
43
-
44
-
45
-
46
-
47
-
48
-
49
-
50
-
51
-
52
-
53
-
54
-
55
-
 56
56 -
 57
57 -
 58
58 -
 59
59 -
 60
60 -
 61
61 -
 62
62 -
 63
63 -
 64
64 -
 65
65 -
 66
66 -
 67
67 -
 68
68 -
 69
69 -
 70
70 -
 71
71 -
 72
72 -
 73
73 -
 74
74 -
 75
75 -
 76
76 -
77
-
78
-
79
-
80
-
81
-
82
-
83
-
84
-
85
-
86
-
87
-
88
-
89
-
90
-
91
-
92
-
93
-
94
-
95
-
96
-
97
-
98
-
99
-
100
-
101
-
102
-
103
-
104
-
105
-
106
-
107
-
108
-
109
-
110
-
111
-
112
-
113
-
114
-
115
-
116
-
117
-
118
-
119
-
120
-
121
-
122
-
123
-
124
-
125
-
126
-
127
-
128
-
129
-
130
-
131
-
132
-
133
-
134
-
135
-
136
-
137
-
138
-
139
-
140
-
141
-
142
-
143
-
144
-
145
-
146
-
147
-
148
-
149
-
150
-
151
-
152
-
153
-
154
-
155
-
156
-
157
-
158
-
159
-
160
-
161
-
162
-
163
-
164
-
165
-
166
-
167
-
168
-
169
-
170
-
171
-
172
-
173
-
174
-
175
-
176
-
177
-
178
-
179
-
180
-
181
-
182
-
183
-
184
 |
 |

Table of Contents
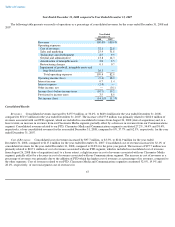
FTD Technology and Development Expenses. FTD technology and development expenses decreased by $0.9 million, or 7%, to
$11.9 million for the year ended December 31, 2009, compared to $12.8 million for the year ended December 31, 2008. FTD technology and
development expenses as a percentage of revenues increased slightly to 2.2% for the year ended December 31, 2009, compared to 2.1% for the
prior-year period. Excluding the impact of foreign currency exchange rates of $1.0 million, technology and development expenses increased by
$0.1 million, or 1%, compared to the prior-year period.
FTD General and Administrative Expenses. FTD general and administrative expenses decreased by $12.4 million, or 22%, to
$43.7 million for the year ended December 31, 2009, compared to $56.2 million for the year ended December 31, 2008. FTD general and
administrative expenses as a percentage of revenues decreased to 8.0% for the year ended December 31, 2009, compared to 9.0% for the prior-
year period. Excluding the impact of foreign currency exchange rates of $0.6 million, general and administrative expenses decreased by
$11.9 million, or 21%, compared to the prior-year period. The decrease was primarily due to $16.2 million of expenses in the prior-year period
related to the acquisition of FTD by the Company and $2.0 million of charges related to acquisition opportunities that were abandoned in light of
the then-pending acquisition of FTD by the Company. The decrease was largely offset by an increase in allocated stock-based compensation and
allocated corporate costs as well as increased bad debt expense for the year ended December 31, 2009.
FTD Impairment of Goodwill, Intangible Assets and Long-Lived Assets. FTD recorded impairment charges of $175.9 million for the year
ended December 31, 2008 due to a reduction in the fair value of the FTD reporting unit compared to its carrying value and lower fair values in
the FTD and Interflora trademarks and trade names compared to their carrying values. There were no such impairments in the year ended
December 31, 2009.
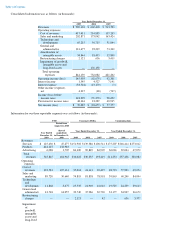
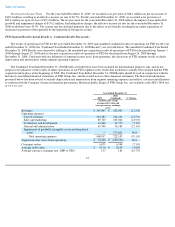
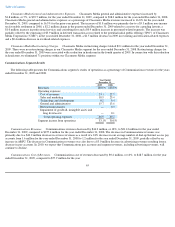
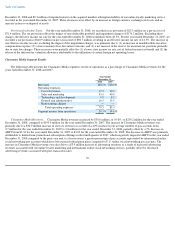
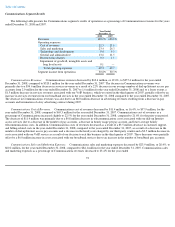
Classmates Media Segment Results
The following table presents the Classmates Media segment's results of operations as a percentage of Classmates Media revenues for the
years ended December 31, 2009 and 2008.
Classmates Media Revenues. Classmates Media revenues increased by $5.8 million, or 3%, to $236.0 million for the year ended
December 31, 2009, compared to $230.2 million for the year ended December 31, 2008. The increase in Classmates Media revenues was
primarily due to a $12.5 million increase in services revenues as a result of a 22% increase in our average number of pay accounts from
3.8 million for the year ended December 31, 2008 to 4.6 million for the year ended December 31, 2009, partially offset by an 11% decrease in
ARPU from $3.09 for the year ended December 31, 2008 to $2.75 for the year ended December 31, 2009. The decrease in ARPU was primarily
attributable to the
63
Year Ended
December 31,
2009
2008
Revenues
100.0
%
100.0
%
Operating expenses:
Cost of revenues
14.8
17.9
Sales and marketing
31.7
35.6
Technology and development
10.8
9.5
General and administrative
16.8
16.5
Restructuring charges
0.9
—
Total operating expenses
75.1
79.5
Segment income from operations
28.6
%
20.5
%