Classmates.com 2009 Annual Report Download - page 70
Download and view the complete annual report
Please find page 70 of the 2009 Classmates.com annual report below. You can navigate through the pages in the report by either clicking on the pages listed below, or by using the keyword search tool below to find specific information within the annual report.-
 1
1 -
2
-
3
-
4
-
5
-
6
-
7
-
8
-
9
-
10
-
11
-
12
-
13
-
14
-
15
-
16
-
17
-
18
-
19
-
20
-
21
-
22
-
23
-
24
-
25
-
26
-
27
-
28
-
29
-
30
-
31
-
32
-
33
-
34
-
35
-
36
-
37
-
38
-
39
-
40
-
41
-
42
-
43
-
44
-
45
-
46
-
47
-
48
-
49
-
50
-
51
-
52
-
53
-
54
-
55
-
56
-
57
-
58
-
59
-
 60
60 -
 61
61 -
 62
62 -
 63
63 -
 64
64 -
 65
65 -
 66
66 -
 67
67 -
 68
68 -
 69
69 -
 70
70 -
 71
71 -
 72
72 -
 73
73 -
 74
74 -
 75
75 -
 76
76 -
 77
77 -
 78
78 -
 79
79 -
 80
80 -
81
-
82
-
83
-
84
-
85
-
86
-
87
-
88
-
89
-
90
-
91
-
92
-
93
-
94
-
95
-
96
-
97
-
98
-
99
-
100
-
101
-
102
-
103
-
104
-
105
-
106
-
107
-
108
-
109
-
110
-
111
-
112
-
113
-
114
-
115
-
116
-
117
-
118
-
119
-
120
-
121
-
122
-
123
-
124
-
125
-
126
-
127
-
128
-
129
-
130
-
131
-
132
-
133
-
134
-
135
-
136
-
137
-
138
-
139
-
140
-
141
-
142
-
143
-
144
-
145
-
146
-
147
-
148
-
149
-
150
-
151
-
152
-
153
-
154
-
155
-
156
-
157
-
158
-
159
-
160
-
161
-
162
-
163
-
164
-
165
-
166
-
167
-
168
-
169
-
170
-
171
-
172
-
173
-
174
-
175
-
176
-
177
-
178
-
179
-
180
-
181
-
182
-
183
-
184
 |
 |

Table of Contents
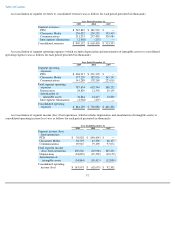
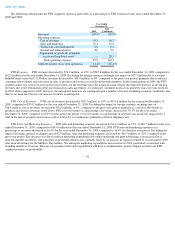
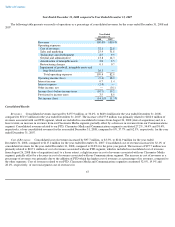
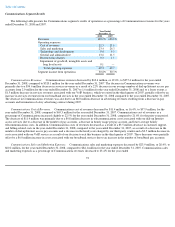
Year Ended December 31, 2008 compared to Year Ended December 31, 2007
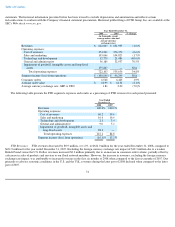
The following table presents our results of operations as a percentage of consolidated revenues for the years ended December 31, 2008 and
2007.
Consolidated Results
Revenues. Consolidated revenues increased by $155.9 million, or 30.4%, to $669.4 million for the year ended December 31, 2008,
compared to $513.5 million for the year ended December 31, 2007. The increase of $155.9 million was primarily related to $182.0 million of
revenues associated with our FTD segment, which are included in consolidated revenues from August 26, 2008 (date of acquisition) and, to a
lesser extent, an increase in revenues from our Classmates Media segment, partially offset by a decrease in revenues from our Communications
segment. Consolidated revenues related to our FTD, Classmates Media and Communications segments constituted 27.2%, 34.4% and 38.4%,
respectively, of our consolidated revenues for the year ended December 31, 2008, compared to 0%, 37.7% and 62.3%, respectively, for the year
ended December 31, 2007.
Cost of Revenues. Consolidated cost of revenues increased by $97.7 million, or 83.3%, to $214.9 million for the year ended
December 31, 2008, compared to $117.2 million for the year ended December 31, 2007. Consolidated cost of revenues increased to 32.1% of
consolidated revenues for the year ended December 31, 2008, compared to 22.8% for the prior-year period. The increase of $97.7 million was
primarily related to $107.1 million of cost of revenues associated with our FTD segment, which is included in consolidated cost of revenues
from August 26, 2008 (date of acquisition) and, to a lesser extent, a slight increase in cost of revenues associated with our Classmates Media
segment, partially offset by a decrease in cost of revenues associated with our Communications segment. The increase in cost of revenues as a
percentage of revenues was primarily due to the addition of FTD which has higher cost of revenues as a percentage of its revenues, compared to
the other segments. Cost of revenues related to our FTD, Classmates Media and Communications segments constituted 52.0%, 19.9% and
28.1%, respectively, of our total segment cost of revenues for
67
Year Ended
December 31,
2008
2007
Revenues
100.0
%
100.0
%
Operating expenses:
Cost of revenues
32.1
22.8
Sales and marketing
25.9
31.8
Technology and development
8.5
9.9
General and administrative
13.8
14.3
Amortization of intangible assets
2.8
2.5
Restructuring charges
0.1
0.7
Impairment of goodwill, intangible assets and
long
-
lived assets
26.3
—
Total operating expenses
109.4
82.0
Operating income (loss)
(9.4
)
18.0
Interest income
0.7
1.4
Interest expense
(2.0
)
—
Other income, net
—
(
0.1
)
Income (loss) before income taxes
(10.7
)
19.2
Provision for income taxes
3.5
8.0
Net income (loss)
(14.1
)%
11.3
%