Blackberry 2011 Annual Report Download - page 93
Download and view the complete annual report
Please find page 93 of the 2011 Blackberry annual report below. You can navigate through the pages in the report by either clicking on the pages listed below, or by using the keyword search tool below to find specific information within the annual report.-
 1
1 -
2
-
3
-
4
-
5
-
6
-
7
-
8
-
9
-
10
-
11
-
12
-
13
-
14
-
15
-
16
-
17
-
18
-
19
-
20
-
21
-
22
-
23
-
24
-
25
-
26
-
27
-
28
-
29
-
30
-
31
-
32
-
33
-
34
-
35
-
36
-
37
-
38
-
39
-
40
-
41
-
42
-
43
-
44
-
45
-
46
-
47
-
48
-
49
-
50
-
51
-
52
-
53
-
54
-
55
-
56
-
57
-
58
-
59
-
60
-
61
-
62
-
63
-
64
-
65
-
66
-
67
-
68
-
69
-
70
-
71
-
72
-
73
-
74
-
75
-
76
-
77
-
78
-
79
-
80
-
81
-
82
-
 83
83 -
 84
84 -
 85
85 -
 86
86 -
 87
87 -
 88
88 -
 89
89 -
 90
90 -
 91
91 -
 92
92 -
 93
93 -
 94
94 -
 95
95
 |
 |

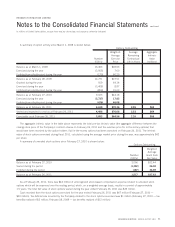
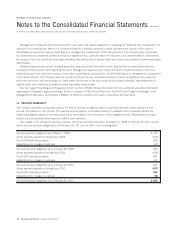
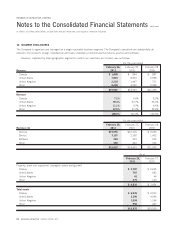
16. SEGMENT DISCLOSURES
The Company is organized and managed as a single reportable business segment. The Company’s operations are substantially all
related to the research, design, manufacture and sales of wireless communications products, services and software.
Revenue, classified by major geographic segments in which our customers are located, was as follows:
Revenue
February 26,
2011
February 27,
2010
February 28,
2009
For the year ended
Canada $ 1,408 $844 $887
United States 7,823 8,620 6,968
United Kingdom 2,218 1,447 711
Other 8,458 4,042 2,499
$19,907 $14,953 $11,065
Revenue
Canada 7.1% 5.6% 8.0%
United States 39.3% 57.7% 63.0%
United Kingdom 11.1% 9.7% 6.4%
Other 42.5% 27.0% 22.6%
100.0% 100.0% 100.0%
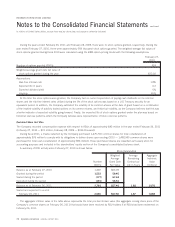
Revenue mix
February 26,
2011
February 27,
2010
February 28,
2009
For the year ended
Devices $15,956 $12,116 $ 9,090
Service 3,197 2,158 1,402
Software 294 259 252
Other 460 420 321
$19,907 $14,953 $11,065
February 26,
2011
February 27,
2010
As at
Property, plant and equipment, intangible assets and goodwill
Canada $ 3,787 $ 2,605
United States 707 683
United Kingdom 41 46
Other 275 100
$ 4,810 $ 3,434
Total assets
Canada $ 6,935 $ 4,503
United States 3,390 4,059
United Kingdom 1,594 1,196
Other 956 447
$12,875 $10,205
80 RESEARCH IN MOTION ANNUAL REPORT 2011
RESEARCH IN MOTION LIMITED
Notes to the Consolidated Financial Statements
continued
In millions of United States dollars, except share and per share data, and except as otherwise indicated