Blackberry 2011 Annual Report Download - page 36
Download and view the complete annual report
Please find page 36 of the 2011 Blackberry annual report below. You can navigate through the pages in the report by either clicking on the pages listed below, or by using the keyword search tool below to find specific information within the annual report.-
 1
1 -
2
-
3
-
4
-
5
-
6
-
7
-
8
-
9
-
10
-
11
-
12
-
13
-
14
-
15
-
16
-
17
-
18
-
19
-
20
-
21
-
22
-
23
-
24
-
25
-
 26
26 -
 27
27 -
 28
28 -
 29
29 -
 30
30 -
 31
31 -
 32
32 -
 33
33 -
 34
34 -
 35
35 -
 36
36 -
 37
37 -
 38
38 -
 39
39 -
 40
40 -
 41
41 -
 42
42 -
 43
43 -
 44
44 -
 45
45 -
 46
46 -
47
-
48
-
49
-
50
-
51
-
52
-
53
-
54
-
55
-
56
-
57
-
58
-
59
-
60
-
61
-
62
-
63
-
64
-
65
-
66
-
67
-
68
-
69
-
70
-
71
-
72
-
73
-
74
-
75
-
76
-
77
-
78
-
79
-
80
-
81
-
82
-
83
-
84
-
85
-
86
-
87
-
88
-
89
-
90
-
91
-
92
-
93
-
94
-
95
 |
 |

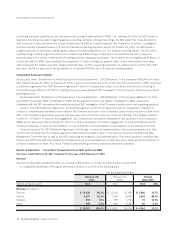
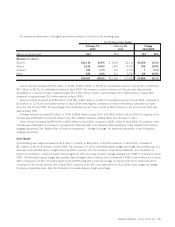
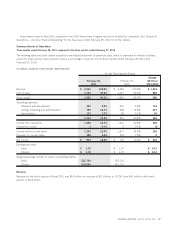
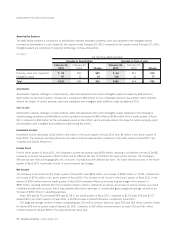
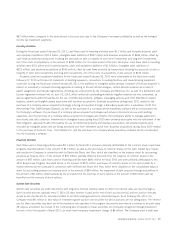
A comparative breakdown of the significant revenue streams is set forth in the following table:
February 27,
2010
February 28,
2009
Change
2010/2009
For the Fiscal Year Ended
Millions of devices sold 36.7 26.0 10.7 41%
Revenue (in millions)
Devices $12,116 81.0% $ 9,090 82.1% $3,026 33.3%
Service 2,158 14.4% 1,402 12.7% 756 53.9%
Software 259 1.7% 252 2.3% 7 2.7%
Other 420 2.9% 321 2.9% 99 30.9%
$14,953 100.0% $11,065 100.0% $3,888 35.1%
Device revenue increased by $3.0 billion, or 33.3%, to $12.1 billion, or 81.0% of consolidated revenue, in fiscal 2010 compared to
$9.1 billion, or 82.1%, of consolidated revenue in fiscal 2009. This increase in device revenue over the prior year was primarily
attributable to a volume increase of approximately 10.7 million units, or 41%, to approximately 36.7 million devices in fiscal 2010
compared to approximately 26.0 million devices in fiscal 2009.
Service revenue increased by $756 million, or 53.9%, to $2.2 billion or 14.4% of consolidated revenue in fiscal 2010, compared to
$1.4 billion, or 12.7% of consolidated revenue in fiscal 2009, reflecting the Company’s increase in BlackBerry subscriber accounts
since the end of fiscal 2009. The percentage of the subscriber account base outside of North America at the end of fiscal 2010 was
approximately 38%.
Software revenue increased $7 million, or 2.7%, to $259 million in fiscal 2010 from $252 million in fiscal 2009. The majority of the
increase was attributable to technical support and other software revenues, partially offset by a decrease in CALs.
Other revenue increased by $99 million to $420 million in fiscal 2010 compared to $321 million in fiscal 2009. The majority of the
increase was attributable to increases in non-warranty repair and sales of accessories offset partially by losses realized from revenue
hedging instruments. See “Market Risk of Financial Instruments — Foreign Exchange” for additional information on the Company’s
hedging instruments.
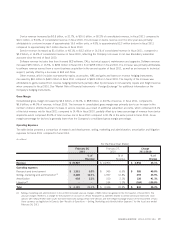
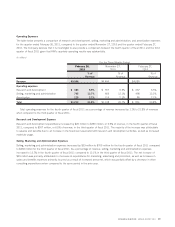
Gross Margin
Consolidated gross margin increased by $1.5 billion, or 29.2%, to $6.6 billion, or 44.0% of revenue, in fiscal 2010, compared to
$5.1 billion, or 46.1% of revenue, in fiscal 2009. The decrease of 2.1% in consolidated gross margin percentage was primarily due to a
decrease in the blended device margins driven by shifts in product mix, the transition to new device platforms, the introduction of
feature rich products to address broader market segments, and a decrease in device average selling prices (“ASPs”) compared to fiscal
2009. This decrease in gross margin was partially offset by higher service revenue which comprised 14.4% of total revenue mix in fiscal
2010 compared to 12.7% in the same period of fiscal 2009 along with a lower percentage of revenue from device shipments which
comprised 81.0% of total revenue mix in fiscal 2010 compared to 82.1% in the same period of fiscal 2009. Gross margin percentage
for devices is generally lower than the Company’s consolidated gross margin percentage.
RESEARCH IN MOTION ANNUAL REPORT 2011 23