Blackberry 2011 Annual Report Download - page 85
Download and view the complete annual report
Please find page 85 of the 2011 Blackberry annual report below. You can navigate through the pages in the report by either clicking on the pages listed below, or by using the keyword search tool below to find specific information within the annual report.-
 1
1 -
2
-
3
-
4
-
5
-
6
-
7
-
8
-
9
-
10
-
11
-
12
-
13
-
14
-
15
-
16
-
17
-
18
-
19
-
20
-
21
-
22
-
23
-
24
-
25
-
26
-
27
-
28
-
29
-
30
-
31
-
32
-
33
-
34
-
35
-
36
-
37
-
38
-
39
-
40
-
41
-
42
-
43
-
44
-
45
-
46
-
47
-
48
-
49
-
50
-
51
-
52
-
53
-
54
-
55
-
56
-
57
-
58
-
59
-
60
-
61
-
62
-
63
-
64
-
65
-
66
-
67
-
68
-
69
-
70
-
71
-
72
-
73
-
74
-
 75
75 -
 76
76 -
 77
77 -
 78
78 -
 79
79 -
 80
80 -
 81
81 -
 82
82 -
 83
83 -
 84
84 -
 85
85 -
 86
86 -
 87
87 -
 88
88 -
 89
89 -
 90
90 -
 91
91 -
 92
92 -
 93
93 -
 94
94 -
 95
95
 |
 |

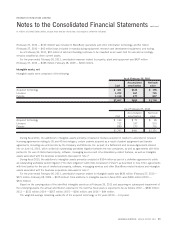
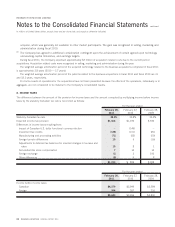
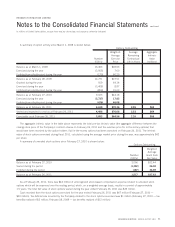
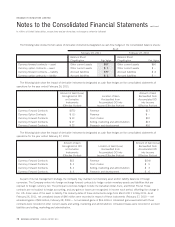
During the years ended February 26, 2011 and February 28, 2009, there were no stock options granted, respectively. During the
year ended February 27, 2010, there were approximately 559 thousand stock options granted. The weighted-average fair values of
stock options granted during fiscal 2010 were calculated using the BSM option-pricing model with the following assumptions:
February 27,
2010
Number of options granted (000’s) 559
Weighted-average grant date fair value of
stock options granted during the year $33.02
Assumptions:
Risk-free interest rate 1.8%
Expected life in years 4.2
Expected dividend yield 0%
Volatility 65%
At the time the stock options were granted, the Company had no current expectation of paying cash dividends on its common
shares and the risk-free interest rates utilized during the life of the stock options was based on a U.S. Treasury security for an
equivalent period. In addition, the Company estimated the volatility of its common shares at the date of grant based on a combination
of the implied volatility of publicly traded options on its common shares, and historical volatility, as the Company believes that this was
a better indicator of expected volatility going forward. Finally, the expected life of stock options granted under the plan was based on
historical exercise patterns, which the Company believes were representative of future exercise patterns.
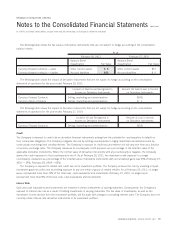
Restricted Share Unit Plan
The Company recorded compensation expense with respect to RSUs of approximately $42 million in the year ended February 26, 2011
(February 27, 2010 — $21 million; February 28, 2009 — $196 thousand).
During fiscal 2011, a trustee selected by the Company purchased 1,470,703 common shares for total consideration of
approximately $76 million to comply with its obligations to deliver shares upon vesting (2010 — 1,458,950 common shares were
purchased for total cash consideration of approximately $94 million). These purchased shares are classified as treasury stock for
accounting purposes and included in the shareholders’ equity section of the Company’s consolidated balance sheet.
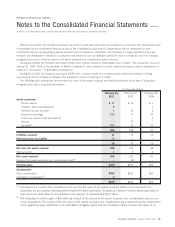
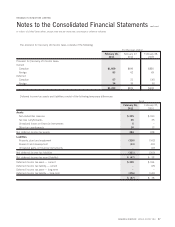
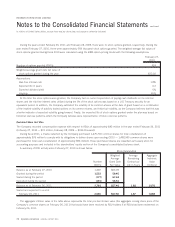
A summary of RSU activity since February 27, 2010 is shown below:
Number
(000’s)
Weighted
Average
Grant Date
Fair Value
Average
Remaining
Contractual
Life in Years
Aggregate
Instrinsic
Value
(millions)
RSUs Outstanding
Balance as at February 27, 2010 1,449 $66.09
Granted during the period 1,532 50.45
Vested during the period (177) 67.64
Cancelled during the period (101) 58.34
Balance as at February 26, 2011 2,703 $57.40 1.88 $178
Vested and expected to vest at
February 26, 2011 2,543 $57.50 1.87 $168
The aggregate intrinsic value in the table above represents the total pre-tax intrinsic value (the aggregate closing share price of the
Company’s common shares on February 26, 2011) that would have been received by RSU holders if all RSUs had been redeemed on
February 26, 2011.
72 RESEARCH IN MOTION ANNUAL REPORT 2011
RESEARCH IN MOTION LIMITED
Notes to the Consolidated Financial Statements
continued
In millions of United States dollars, except share and per share data, and except as otherwise indicated