Blackberry 2011 Annual Report Download - page 91
Download and view the complete annual report
Please find page 91 of the 2011 Blackberry annual report below. You can navigate through the pages in the report by either clicking on the pages listed below, or by using the keyword search tool below to find specific information within the annual report.-
 1
1 -
2
-
3
-
4
-
5
-
6
-
7
-
8
-
9
-
10
-
11
-
12
-
13
-
14
-
15
-
16
-
17
-
18
-
19
-
20
-
21
-
22
-
23
-
24
-
25
-
26
-
27
-
28
-
29
-
30
-
31
-
32
-
33
-
34
-
35
-
36
-
37
-
38
-
39
-
40
-
41
-
42
-
43
-
44
-
45
-
46
-
47
-
48
-
49
-
50
-
51
-
52
-
53
-
54
-
55
-
56
-
57
-
58
-
59
-
60
-
61
-
62
-
63
-
64
-
65
-
66
-
67
-
68
-
69
-
70
-
71
-
72
-
73
-
74
-
75
-
76
-
77
-
78
-
79
-
80
-
 81
81 -
 82
82 -
 83
83 -
 84
84 -
 85
85 -
 86
86 -
 87
87 -
 88
88 -
 89
89 -
 90
90 -
 91
91 -
 92
92 -
 93
93 -
 94
94 -
 95
95
 |
 |

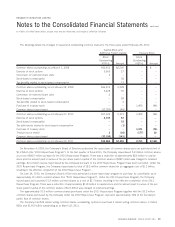
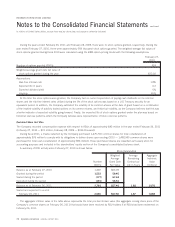
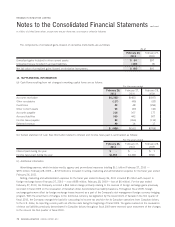
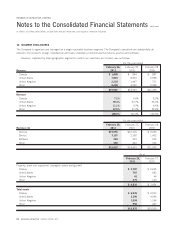
The following table shows the fair values of derivative instruments designated as cash flow hedges in the consolidated balance sheets:
Balance Sheet
Classification Fair Value
Balance Sheet
Classification Fair Value
February 26, 2011 February 27, 2010
As at
Currency forward contracts — asset Other current assets $57 Other current assets $66
Currency option contracts — asset Other current assets $1 Other current assets $ –
Currency forward contracts — liability Accrued liabilities $77 Accrued liabilities $ 4
Currency option contracts — liability Accrued liabilities $1 Accrued liabilities $ –
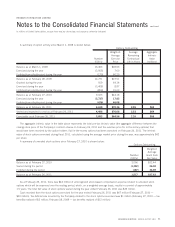
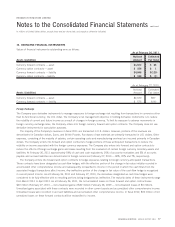
The following table show the impact of derivative instruments designated as cash flow hedges on the consolidated statements of
operations for the year ended February 26, 2011:
Amount of Gain (Loss)
Recognized in OCI
on Derivative
Instruments
(Effective Portion)
Location of Gain
Reclassified from
Accumulated OCI into
Income (Effective Portion)
Amount of Gain
Reclassified from
Accumulated OCI
into Income
(Effective Portion)
Currency Forward Contracts $(73) Revenue $17
Currency Option Contracts $ (1) Revenue $ –
Currency Forward Contracts $ 13 Cost of sales $10
Currency Forward Contracts $ 17 Selling, marketing and administration $13
Currency Forward Contracts $ 23 Research and development $16
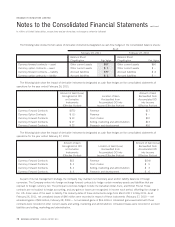
The following table show the impact of derivative instruments designated as cash flow hedges on the consolidated statements of
operations for the year ended February 27, 2010:
Amount of Gain
Recognized in OCI
on Derivative
Instruments
(Effective Portion)
Location of Gain (Loss)
Reclassified from
Accumulated OCI into
Income (Effective Portion)
Amount of Gain (Loss)
Reclassified from
Accumulated OCI
into Income
(Effective Portion)
Currency Forward Contracts $52 Revenue $(34)
Currency Forward Contracts $ 3 Cost of sales $ 5
Currency Forward Contracts $ 2 Selling, marketing and administration $ 3
Currency Forward Contracts $ 5 Research and development $ 6
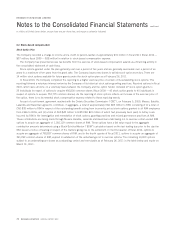
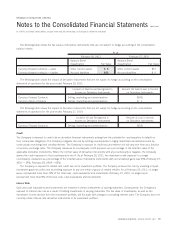
As part of its risk management strategy, the Company may maintain net monetary asset and/or liability balances in foreign
currencies. The Company enters into foreign exchange forward contracts to hedge certain monetary assets and liabilities that are
exposed to foreign currency risk. The principal currencies hedged include the Canadian dollar, Euro, and British Pound. These
contracts are not subject to hedge accounting, and any gains or losses are recognized in income each period, offsetting the change in
the U.S. dollar value of the asset or liability. The maturity dates of these instruments range from March 2011 to May 2011. As at
February 26, 2011, net unrealized losses of $46 million were recorded in respect of these instruments (February 27, 2010 — net
unrealized gains of $29 million; February 28, 2009 — net unrealized gains of $16 million). Unrealized gains associated with these
contracts were recorded in other current assets and selling, marketing and administration. Unrealized losses were recorded in accrued
liabilities and selling, marketing and administration.
78 RESEARCH IN MOTION ANNUAL REPORT 2011
RESEARCH IN MOTION LIMITED
Notes to the Consolidated Financial Statements
continued
In millions of United States dollars, except share and per share data, and except as otherwise indicated