Blackberry 2011 Annual Report Download - page 23
Download and view the complete annual report
Please find page 23 of the 2011 Blackberry annual report below. You can navigate through the pages in the report by either clicking on the pages listed below, or by using the keyword search tool below to find specific information within the annual report.-
 1
1 -
2
-
3
-
4
-
5
-
6
-
7
-
8
-
9
-
10
-
11
-
12
-
 13
13 -
 14
14 -
 15
15 -
 16
16 -
 17
17 -
 18
18 -
 19
19 -
 20
20 -
 21
21 -
 22
22 -
 23
23 -
 24
24 -
 25
25 -
 26
26 -
 27
27 -
 28
28 -
 29
29 -
 30
30 -
 31
31 -
 32
32 -
 33
33 -
34
-
35
-
36
-
37
-
38
-
39
-
40
-
41
-
42
-
43
-
44
-
45
-
46
-
47
-
48
-
49
-
50
-
51
-
52
-
53
-
54
-
55
-
56
-
57
-
58
-
59
-
60
-
61
-
62
-
63
-
64
-
65
-
66
-
67
-
68
-
69
-
70
-
71
-
72
-
73
-
74
-
75
-
76
-
77
-
78
-
79
-
80
-
81
-
82
-
83
-
84
-
85
-
86
-
87
-
88
-
89
-
90
-
91
-
92
-
93
-
94
-
95
 |
 |

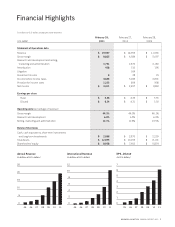
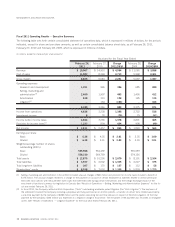
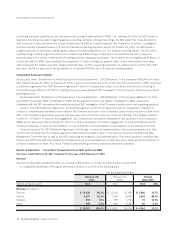
Fiscal 2011 Operating Results — Executive Summary
The following table sets forth certain consolidated statement of operations data, which is expressed in millions of dollars, for the periods
indicated, except for share and per share amounts, as well as certain consolidated balance sheet data, as at February 26, 2011,
February 27, 2010 and February 28, 2009, which is expressed in millions of dollars.
(in millions, except for share and per share amounts)
February 26,
2011
February 27,
2010
Change
2011/2010
February 28,
2009
Change
2010/2009
As at and for the Fiscal Year Ended
Revenue $ 19,907 $ 14,953 $ 4,954 $ 11,065 $ 3,888
Cost of sales 11,082 8,369 2,713 5,968 2,401
Gross margin 8,825 6,584 2,241 5,097 1,487
Operating expenses
Research and development 1,351 965 386 685 280
Selling, marketing and
administration
(1)
2,400 1,907 493 1,495 412
Amortization 438 310 128 195 115
Litigation
(2)
–164 (164) –164
4,189 3,346 843 2,375 971
Income from operations 4,636 3,238 1,398 2,722 516
Investment income 828 (20) 79 (51)
Income before income taxes 4,644 3,266 1,378 2,801 465
Provision for income taxes
(1)
1,233 809 424 908 (99)
Net income $ 3,411 $ 2,457 $ 954 $ 1,893 $ 564
Earnings per share
Basic $ 6.36 $ 4.35 $ 2.01 $ 3.35 $ 1.00
Diluted $ 6.34 $ 4.31 $ 2.03 $ 3.30 $ 1.01
Weighted-average number of shares
outstanding (000’s)
Basic 535,986 564,492 565,059
Diluted 538,330 569,759 574,156
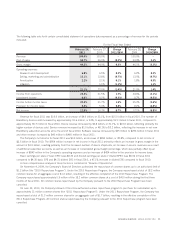
Total assets $ 12,875 $ 10,205 $ 2,670 $ 8,101 $ 2,104
Total liabilities $ 3,937 $ 2,602 $ 1,335 $ 2,227 $ 375
Total long-term liabilities $307 $ 170 $ 137 $ 112 $58
Shareholders’ equity $ 8,938 $ 7,603 $ 1,335 $ 5,874 $ 1,729
(1) Selling, marketing and administration in fiscal 2010 included unusual charges of $96 million and provision for income taxes included a benefit of
$175 million. The unusual charges related to a charge for the payment on account of certain employee tax liabilities related to certain previously-
exercised stock options with measurement date issues that were exercised during certain time periods and the foreign exchange impact of the
enactment of functional currency tax legislation in Canada. See “Results of Operations — Selling, Marketing and Administration Expenses” for the fis-
cal year ended February 26, 2011.
(2) In fiscal 2010, the Company settled all Visto Corporation (“Visto”) outstanding worldwide patent litigation (the “Visto Litigation”). The key terms of
the settlement involved the Company receiving a perpetual and fully-paid license on all Visto patents, a transfer of certain Visto intellectual property,
a one-time payment by the Company of $268 million and the parties executing full and final releases in respect of the Visto Litigation. Of the total
payment by the Company, $164 million was expensed as a litigation charge in fiscal 2010. The remainder of the payment was recorded as intangible
assets. See “Results of Operations — Litigation Expense” for the fiscal year ended February 26, 2011.
10 RESEARCH IN MOTION ANNUAL REPORT 2011
MANAGEMENT’S DISCUSSION AND ANALYSIS