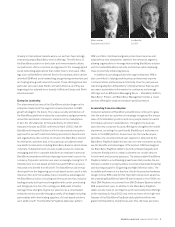
Blackberry 2011 Annual Report Download - page 14
Download and view the complete annual report
Please find page 14 of the 2011 Blackberry annual report below. You can navigate through the pages in the report by either clicking on the pages listed below, or by using the keyword search tool below to find specific information within the annual report.-
 1
1 -
2
-
3
-
 4
4 -
 5
5 -
 6
6 -
 7
7 -
 8
8 -
 9
9 -
 10
10 -
 11
11 -
 12
12 -
 13
13 -
 14
14 -
 15
15 -
 16
16 -
 17
17 -
 18
18 -
 19
19 -
 20
20 -
 21
21 -
 22
22 -
 23
23 -
 24
24 -
25
-
26
-
27
-
28
-
29
-
30
-
31
-
32
-
33
-
34
-
35
-
36
-
37
-
38
-
39
-
40
-
41
-
42
-
43
-
44
-
45
-
46
-
47
-
48
-
49
-
50
-
51
-
52
-
53
-
54
-
55
-
56
-
57
-
58
-
59
-
60
-
61
-
62
-
63
-
64
-
65
-
66
-
67
-
68
-
69
-
70
-
71
-
72
-
73
-
74
-
75
-
76
-
77
-
78
-
79
-
80
-
81
-
82
-
83
-
84
-
85
-
86
-
87
-
88
-
89
-
90
-
91
-
92
-
93
-
94
-
95
 |
 |
RESEARCH IN MOTION ANNUAL REPORT 2011 1
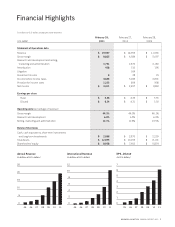
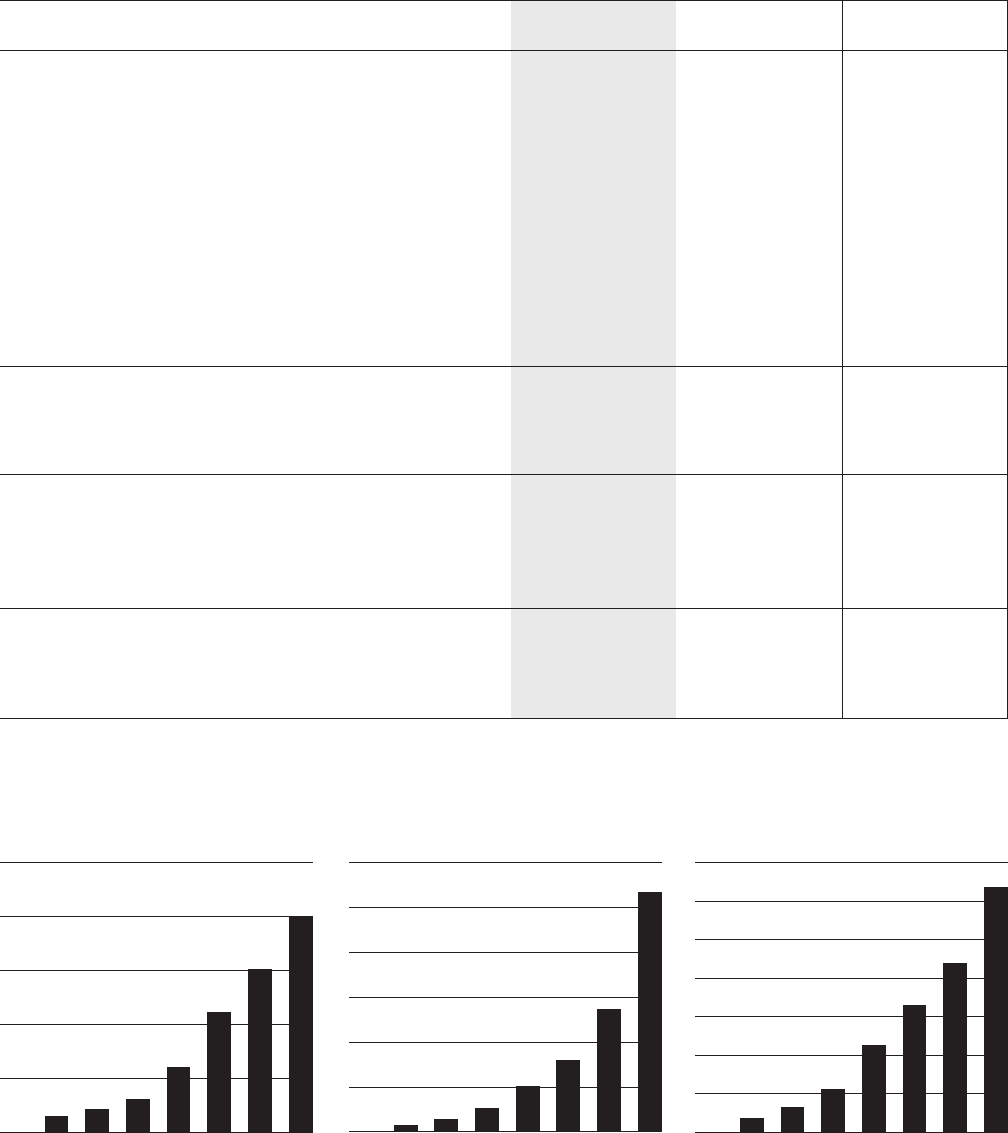
(in millions of U.S. dollars, except per share amounts)
February 26, February 27, February 28,
U.S. GAAP 2011 2010 2009
Statement of Operations data
Revenue $ 19,907 $ 14,953 $ 11,065
Gross margin $ 8,825 $ 6,584 $ 5,097
Research and development and selling,
marketing and administration 3,751 2,872 2,180
Amortization 438 310 195
Litigation 164
Investment income 8 28 79
Income before income taxes 4,644 3,266 2,801
Provision for income taxes 1,233 809 908
Net income $ 3,411 $ 2,457 $ 1,893
Earnings per share
Basic $ 6.36 $ 4.35 $ 3.35
Diluted $ 6.34 $ 4.31 $ 3.30
Operating data [percentage of revenue]
Gross margin 44.3% 44.0% 46.1%
Research and development 6.8% 6.5% 6.2%
Selling, marketing and administration 12.1% 12.8% 13.5%
Balance Sheet data
Cash, cash equivalents, short-term investments
and long-term investments $ 2,698 $ 2,870 $ 2,239
Total Assets $ 12,875 $ 10,205 $ 8,101
Shareholders’ equity $ 8,938 $ 7,603 $ 5,874
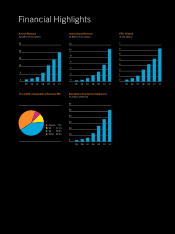
Financial Highlights
2 5
2 0
1 5
1 0
5
0
1 2
1 0
8
6
4
2
0
7
6
5
4
3
2
1
0
Annual Revenue
(in billions of U.S. dollars)
International Revenue
(in billions of U.S. dollars)
EPS–Diluted
(in U.S. dollars)
05 06 07 08 09 10 11 05 06 07 08 09 10 11 05 06 07 08 09 10 11