Blackberry 2011 Annual Report Download - page 32
Download and view the complete annual report
Please find page 32 of the 2011 Blackberry annual report below. You can navigate through the pages in the report by either clicking on the pages listed below, or by using the keyword search tool below to find specific information within the annual report.-
 1
1 -
2
-
3
-
4
-
5
-
6
-
7
-
8
-
9
-
10
-
11
-
12
-
13
-
14
-
15
-
16
-
17
-
18
-
19
-
20
-
21
-
 22
22 -
 23
23 -
 24
24 -
 25
25 -
 26
26 -
 27
27 -
 28
28 -
 29
29 -
 30
30 -
 31
31 -
 32
32 -
 33
33 -
 34
34 -
 35
35 -
 36
36 -
 37
37 -
 38
38 -
 39
39 -
 40
40 -
 41
41 -
 42
42 -
43
-
44
-
45
-
46
-
47
-
48
-
49
-
50
-
51
-
52
-
53
-
54
-
55
-
56
-
57
-
58
-
59
-
60
-
61
-
62
-
63
-
64
-
65
-
66
-
67
-
68
-
69
-
70
-
71
-
72
-
73
-
74
-
75
-
76
-
77
-
78
-
79
-
80
-
81
-
82
-
83
-
84
-
85
-
86
-
87
-
88
-
89
-
90
-
91
-
92
-
93
-
94
-
95
 |
 |

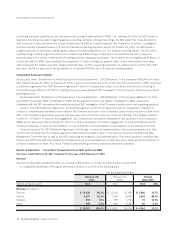
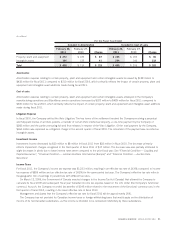
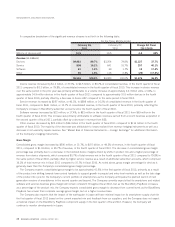
Device revenue increased by $3.8 billion, or 31.7%, to $16.0 billion, or 80.2% of consolidated revenue, in fiscal 2011 compared to
$12.1 billion, or 81.0%, of consolidated revenue in fiscal 2010. This increase in device revenue over the prior year was primarily
attributable to a volume increase of approximately 15.6 million units, or 43%, to approximately 52.3 million devices in fiscal 2011
compared to approximately 36.7 million devices in fiscal 2010.
Service revenue increased by $1.0 billion, or 48.1%, to $3.2 billion or 16.1% of consolidated revenue in fiscal 2011, compared to
$2.2 billion, or 14.4% of consolidated revenue in fiscal 2010, reflecting the Company’s increase in net new BlackBerry subscriber
accounts since the end of fiscal 2010.
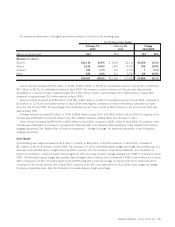
Software revenue includes fees from licensed BES software, CALs, technical support, maintenance and upgrades. Software revenue
increased $35 million, or 13.5%, to $294 million in fiscal 2011 from $259 million in fiscal 2010. The increase was primarily attributable
to software revenue earned from a recent business acquisition in the second quarter of fiscal 2011, as well as an increase in technical
support, partially offset by a decrease in BES and CALs.
Other revenue, which includes non-warranty repairs, accessories, NRE and gains and losses on revenue hedging instruments,
increased by $40 million to $460 million in fiscal 2011 compared to $420 million in fiscal 2010. The majority of the increase was
attributable to gains realized from revenue hedging instruments partially offset by decreases in non-warranty repairs and freight revenue
when compared to fiscal 2010. See “Market Risk of Financial Instruments — Foreign Exchange” for additional information on the
Company’s hedging instruments.
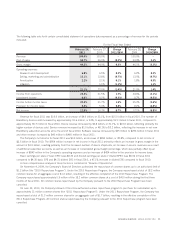
Gross Margin
Consolidated gross margin increased by $2.2 billion, or 34.0%, to $8.8 billion, or 44.3% of revenue, in fiscal 2011, compared to
$6.6 billion, or 44.0% of revenue, in fiscal 2010. The increase in consolidated gross margin was primarily due to an increase in the
number of device shipments and an increase in service revenues as a result of additional subscriber accounts, which comprised 16.1%
of the total revenue mix for fiscal 2011 compared to 14.4% in fiscal 2010, partially offset by a lower percentage of revenue from device
shipments which comprised 80.2% of total revenue mix in fiscal 2011 compared to 81.0% in the same period in fiscal 2010. Gross
margin percentage for devices is generally lower than the Company’s consolidated gross margin percentage.
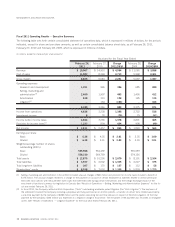
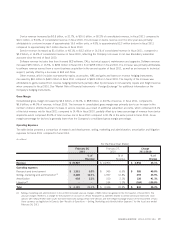
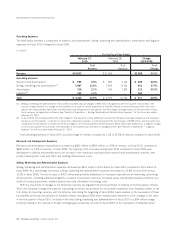
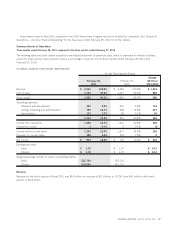
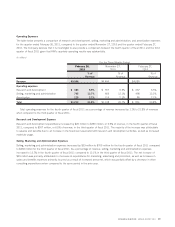
Operating Expenses
The table below presents a comparison of research and development, selling, marketing and administration, amortization and litigation
expenses for fiscal 2011 compared to fiscal 2010.
(in millions)
%of
Revenue
%of
Revenue
%of
Change
February 26,
2011
February 27,
2010
Change
2011/2010
For the Fiscal Year Ended
Revenue $ 19,907 $ 14,953 $ 4,954 33.1%
Operating expenses
Research and development $ 1,351 6.8% $ 965 6.5% $ 386 40.0%
Selling, marketing and administration
(1)
2,400 12.1% 1,907 12.8% 493 25.9%
Amortization 438 2.2% 310 2.1% 128 41.3%
Litigation
(2)
–– 164 1.1% (164) -100.0%
Total $ 4,189 21.1% $ 3,346 22.5% $ 843 25.2%
(1) Selling, marketing and administration in fiscal 2010 included unusual charges of $96 million recognized in the first quarter of fiscal 2010. The
unusual charges related to a charge for the payment on account of certain employee tax liabilities related to certain previously-exercised stock
options with measurement date issues that were exercised during certain time periods and the foreign exchange impact of the enactment of func-
tional currency tax legislation in Canada. See “Results of Operations — Selling, Marketing and Administration Expenses” for the fiscal year ended
February 26, 2011.
RESEARCH IN MOTION ANNUAL REPORT 2011 19