Blackberry 2011 Annual Report Download - page 53
Download and view the complete annual report
Please find page 53 of the 2011 Blackberry annual report below. You can navigate through the pages in the report by either clicking on the pages listed below, or by using the keyword search tool below to find specific information within the annual report.-
 1
1 -
2
-
3
-
4
-
5
-
6
-
7
-
8
-
9
-
10
-
11
-
12
-
13
-
14
-
15
-
16
-
17
-
18
-
19
-
20
-
21
-
22
-
23
-
24
-
25
-
26
-
27
-
28
-
29
-
30
-
31
-
32
-
33
-
34
-
35
-
36
-
37
-
38
-
39
-
40
-
41
-
42
-
 43
43 -
 44
44 -
 45
45 -
 46
46 -
 47
47 -
 48
48 -
 49
49 -
 50
50 -
 51
51 -
 52
52 -
 53
53 -
 54
54 -
 55
55 -
 56
56 -
 57
57 -
 58
58 -
 59
59 -
 60
60 -
 61
61 -
 62
62 -
 63
63 -
64
-
65
-
66
-
67
-
68
-
69
-
70
-
71
-
72
-
73
-
74
-
75
-
76
-
77
-
78
-
79
-
80
-
81
-
82
-
83
-
84
-
85
-
86
-
87
-
88
-
89
-
90
-
91
-
92
-
93
-
94
-
95
 |
 |
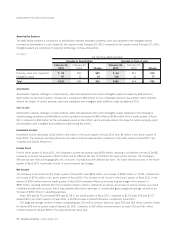
continues to experience significant sales growth, resulting in the growth in its carrier customer base in terms of numbers, sales and
account receivables volumes, and in some instances, new or significantly increased credit limits. The Company, in the normal course of
business, monitors the financial condition of its customers and reviews the credit history of each new customer. The Company
establishes an allowance for doubtful accounts that corresponds to the specific credit risk of its customers, historical trends, and
economic circumstances. The allowance as at February 26, 2011 is $2 million (February 27, 2010 — $2 million). The Company also
places insurance coverage for a portion of its accounts receivable balances. While the Company sells to a variety of customers, one
customer comprised 15% of accounts receivable as at February 26, 2011 (February 27, 2010 — one customer comprised 14%).
Additionally, two customers comprised 11% each of the Company’s fiscal 2011 revenue (fiscal 2010 revenue — three customers
comprised 20%, 13% and 10%).
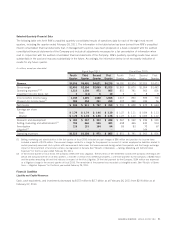
The Company is exposed to credit risk on derivative financial instruments arising from the potential for counterparties to default on
their contractual obligations. The Company mitigates this risk by limiting counterparties to highly rated financial institutions and by
continuously monitoring their creditworthiness. The Company’s exposure to credit loss and market risk will vary over time as a function
of currency exchange rates. The Company measures its counterparty credit exposure as a percentage of the total fair value of the
applicable derivative instruments. Where the net fair value of derivative instruments with any counterparty is negative, the Company
deems the credit exposure to that counterparty to be nil. As at February 26, 2011, the maximum credit exposure to a single
counterparty, measured as a percentage of the total fair value of derivative instruments with net unrealized gains was 59% (February 27,
2010 — 24%).
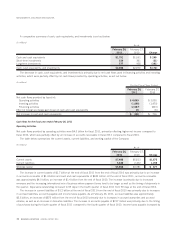
The Company is exposed to market price and credit risk on its investment portfolio. The Company reduces this risk by investing in
liquid, investment grade securities and by limiting exposure to any one entity or group of related entities. As at February 26, 2011, no
single issuer represented more than 19% of the total cash, cash equivalents and investments (February 27, 2010 — no single issuer
represented more than 8% of the total cash, cash equivalents and investments).
Market values are determined for each individual security in the investment portfolio. The Company assesses declines in the value
of individual investments for impairment to determine whether the decline is other-than-temporary. The Company makes this
assessment by considering available evidence, including changes in general market conditions, specific industry and individual
company data, the length of time and the extent to which the fair value has been less than cost, the financial condition, the near-term
prospects of the individual investment and the Company’s ability and intent to hold the debt securities to maturity. During fiscal 2011,
the Company recorded an other-than-temporary impairment charge on its auction rate securities in the amount of $6 million. In
addition, the Company recorded an other-than-temporary impairment charge on its LBIE bankruptcy trust claim in the amount of
$11 million.
Disclosure Controls and Procedures and Internal Controls
Disclosure Controls and Procedures
As of February 26, 2011, the Company carried out an evaluation, under the supervision and with the participation of the Company’s
management, including the Company’s Co-CEOs and its Chief Financial Officer, of the effectiveness of the design and operation of the
Company’s disclosure controls and procedures, as defined in Rules 13(a)-15(e) and 15(d)-15(e) under the U.S. Exchange Act. Based
on that evaluation, the Co-CEOs and the Chief Financial Officer have concluded that, as of such date, the Company’s disclosure
controls and procedures were effective to give reasonable assurance that the information required to be disclosed by the Company in
reports that it files or submits under the U.S. Exchange Act is (i) recorded, processed, summarized and reported, within the time
periods specified in the SEC’s rules and forms, and (ii) accumulated and communicated to management, including its principal
executive and principal financial officers, or persons performing similar functions, as appropriate to allow timely decisions regarding
required disclosure.
Management’s Report on Internal Control Over Financial Reporting
Management of the Company is responsible for establishing and maintaining adequate internal control over financial reporting. Internal
control over financial reporting is defined in Rule 13(a)-15(f) and 15(d)-15(f) under the U.S. Exchange Act as a process designed by, or
under the supervision of, the Company’s principal executive and principal financial officers and effected by the Company’s Board of
Directors, management and other personnel to provide reasonable assurance regarding the reliability of financial reporting and the
40 RESEARCH IN MOTION ANNUAL REPORT 2011
MANAGEMENT’S DISCUSSION AND ANALYSIS