Blackberry 2011 Annual Report Download - page 88
Download and view the complete annual report
Please find page 88 of the 2011 Blackberry annual report below. You can navigate through the pages in the report by either clicking on the pages listed below, or by using the keyword search tool below to find specific information within the annual report.-
 1
1 -
2
-
3
-
4
-
5
-
6
-
7
-
8
-
9
-
10
-
11
-
12
-
13
-
14
-
15
-
16
-
17
-
18
-
19
-
20
-
21
-
22
-
23
-
24
-
25
-
26
-
27
-
28
-
29
-
30
-
31
-
32
-
33
-
34
-
35
-
36
-
37
-
38
-
39
-
40
-
41
-
42
-
43
-
44
-
45
-
46
-
47
-
48
-
49
-
50
-
51
-
52
-
53
-
54
-
55
-
56
-
57
-
58
-
59
-
60
-
61
-
62
-
63
-
64
-
65
-
66
-
67
-
68
-
69
-
70
-
71
-
72
-
73
-
74
-
75
-
76
-
77
-
 78
78 -
 79
79 -
 80
80 -
 81
81 -
 82
82 -
 83
83 -
 84
84 -
 85
85 -
 86
86 -
 87
87 -
 88
88 -
 89
89 -
 90
90 -
 91
91 -
 92
92 -
 93
93 -
 94
94 -
 95
95
 |
 |

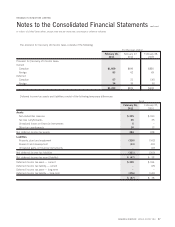
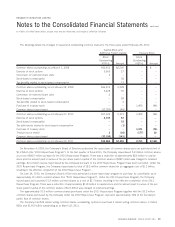
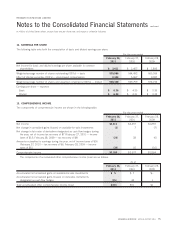
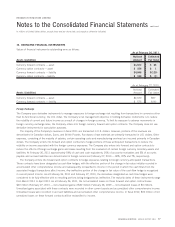
12. EARNINGS PER SHARE
The following table sets forth the computation of basic and diluted earnings per share:
February 26,
2011
February 27,
2010
February 28,
2009
For the year ended
Net income for basic and diluted earnings per share available to common
shareholders $ 3,411 $ 2,457 $ 1,893
Weighted-average number of shares outstanding (000’s) — basic 535,986 564,492 565,059
Effect of dilutive securities (000’s) — stock-based compensation 2,344 5,267 9,097
Weighted-average number of shares and assumed conversions (000’s) — diluted 538,330 569,759 574,156
Earnings per share — reported
Basic $ 6.36 $ 4.35 $ 3.35
Diluted $ 6.34 $ 4.31 $ 3.30
13. COMPREHENSIVE INCOME
The components of comprehensive income are shown in the following table:
February 26,
2011
February 27,
2010
February 28,
2009
For the year ended
Net income $3,411 $2,457 $1,893
Net change in unrealized gains (losses) on available-for-sale investments (2) 7(7)
Net change in fair value of derivatives designated as cash flow hedges during
the year, net of income tax recovery of $7 (February 27, 2010 — income
taxes of $13; February 28, 2009 — tax recovery of $9) (20) 28 (6)
Amounts reclassified to earnings during the year, net of income taxes of $16
(February 27, 2010 — tax recovery of $6; February 28, 2009 — income
taxes of $5) (39) 15 (16)
Comprehensive income $3,350 $2,507 $1,864
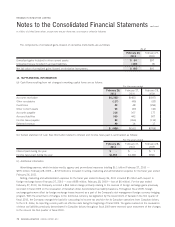
The components of accumulated other comprehensive income (loss) are as follows:
February 26,
2011
February 27,
2010
February 28,
2009
As at
Accumulated net unrealized gains on available-for-sale investments $5 $7 $–
Accumulated net unrealized gains (losses) on derivative instruments
designated as cash flow hedges (15) 44 1
Total accumulated other comprehensive income (loss) $(10) $51 $1
RESEARCH IN MOTION ANNUAL REPORT 2011 75
RESEARCH IN MOTION LIMITED
Notes to the Consolidated Financial Statements
continued
In millions of United States dollars, except share and per share data, and except as otherwise indicated