Blackberry 2011 Annual Report Download - page 82
Download and view the complete annual report
Please find page 82 of the 2011 Blackberry annual report below. You can navigate through the pages in the report by either clicking on the pages listed below, or by using the keyword search tool below to find specific information within the annual report.-
 1
1 -
2
-
3
-
4
-
5
-
6
-
7
-
8
-
9
-
10
-
11
-
12
-
13
-
14
-
15
-
16
-
17
-
18
-
19
-
20
-
21
-
22
-
23
-
24
-
25
-
26
-
27
-
28
-
29
-
30
-
31
-
32
-
33
-
34
-
35
-
36
-
37
-
38
-
39
-
40
-
41
-
42
-
43
-
44
-
45
-
46
-
47
-
48
-
49
-
50
-
51
-
52
-
53
-
54
-
55
-
56
-
57
-
58
-
59
-
60
-
61
-
62
-
63
-
64
-
65
-
66
-
67
-
68
-
69
-
70
-
71
-
 72
72 -
 73
73 -
 74
74 -
 75
75 -
 76
76 -
 77
77 -
 78
78 -
 79
79 -
 80
80 -
 81
81 -
 82
82 -
 83
83 -
 84
84 -
 85
85 -
 86
86 -
 87
87 -
 88
88 -
 89
89 -
 90
90 -
 91
91 -
 92
92 -
93
-
94
-
95
 |
 |

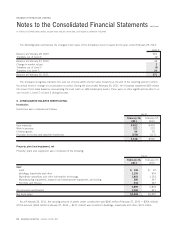
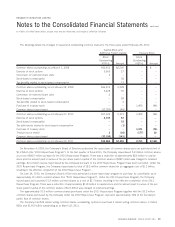
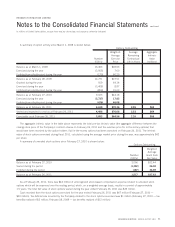
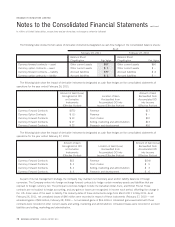
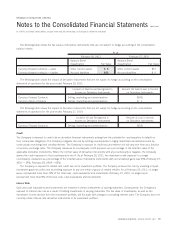
The following details the changes in issued and outstanding common shares for the three years ended February 26, 2011:
Stock
Outstanding
(000’s) Amount
Stock
Outstanding
(000’s) Amount
Capital Stock and
Additional Paid-In Capital Treasury Stock
Common shares outstanding as at March 1, 2008 562,652 $2,250 – $ –
Exercise of stock options 3,565 27 – –
Conversion of restricted share units 2 – – –
Stock-based compensation – 38 – –
Tax benefits related to stock-based compensation – 13 – –
Common shares outstanding as at February 28, 2009 566,219 2,328 – –
Exercise of stock options 3,408 30 – –
Conversion of restricted share units 2 – – –
Stock-based compensation – 58 – –
Tax benefits related to stock-based compensation – 2 – –
Purchase of treasury stock – – 1,459 (94)
Common shares repurchased (12,300) (46) – –
Common shares outstanding as at February 27, 2010 557,329 2,372 1,459 (94)
Exercise of stock options 3,737 67 – –
Stock-based compensation –72 – –
Tax deficiencies related to stock-based compensation –(1) – –
Purchase of treasury stock – – 1,471 (76)
Treasury stock vested 2 (10) (177) 10
Common shares repurchased (37,199) (141) – –
Common shares outstanding as at February 26, 2011 523,869 $2,359 2,753 $(160)
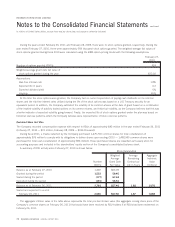
On November 4, 2009, the Company’s Board of Directors authorized the repurchase of common shares up to an authorized limit of
$1.2 billion (the “2010 Repurchase Program”). In the first quarter of fiscal 2011, the Company repurchased 5.9 million common shares
at a cost of $410 million pursuant to the 2010 Repurchase Program. There was a reduction of approximately $23 million to capital
stock and the amount paid in excess of the per share paid-in capital of the common shares of $387 million was charged to retained
earnings. All common shares repurchased by the Company pursuant to the 2010 Repurchase Program have been cancelled. Under the
2010 Repurchase Program, the Company repurchased a total of 18.2 million common shares for an aggregate cost of $1.2 billion,
resulting in the effective completion of the 2010 Repurchase Program.
On June 24, 2010, the Company’s Board of Directors authorized a share repurchase program to purchase for cancellation up to
approximately 31 million common shares (the “2011 Repurchase Program”). Under the 2011 Repurchase Program, the Company
repurchased and cancelled 31.3 million common shares at a cost of $1.7 billion, resulting in the effective completion of the 2011
Repurchase Program. There was a reduction of approximately $119 million to capital stock and the amount paid in excess of the per
share paid-in capital of the common shares of $1.6 billion was charged to retained earnings.
The approximately 31.3 million common shares purchased under the 2011 Repurchase Program together with the 18.2 million
common shares purchased by the Company under the 2010 Repurchase Program, represent approximately 10% of the Company’s
public float of common shares.
The Company had 524 million voting common shares outstanding, options to purchase 5 million voting common shares, 3 million
RSUs and 51,500 DSUs outstanding as at March 22, 2011.
RESEARCH IN MOTION ANNUAL REPORT 2011 69
RESEARCH IN MOTION LIMITED
Notes to the Consolidated Financial Statements
continued
In millions of United States dollars, except share and per share data, and except as otherwise indicated