Blackberry 2011 Annual Report Download - page 44
Download and view the complete annual report
Please find page 44 of the 2011 Blackberry annual report below. You can navigate through the pages in the report by either clicking on the pages listed below, or by using the keyword search tool below to find specific information within the annual report.-
 1
1 -
2
-
3
-
4
-
5
-
6
-
7
-
8
-
9
-
10
-
11
-
12
-
13
-
14
-
15
-
16
-
17
-
18
-
19
-
20
-
21
-
22
-
23
-
24
-
25
-
26
-
27
-
28
-
29
-
30
-
31
-
32
-
33
-
 34
34 -
 35
35 -
 36
36 -
 37
37 -
 38
38 -
 39
39 -
 40
40 -
 41
41 -
 42
42 -
 43
43 -
 44
44 -
 45
45 -
 46
46 -
 47
47 -
 48
48 -
 49
49 -
 50
50 -
 51
51 -
 52
52 -
 53
53 -
 54
54 -
55
-
56
-
57
-
58
-
59
-
60
-
61
-
62
-
63
-
64
-
65
-
66
-
67
-
68
-
69
-
70
-
71
-
72
-
73
-
74
-
75
-
76
-
77
-
78
-
79
-
80
-
81
-
82
-
83
-
84
-
85
-
86
-
87
-
88
-
89
-
90
-
91
-
92
-
93
-
94
-
95
 |
 |

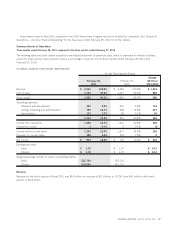
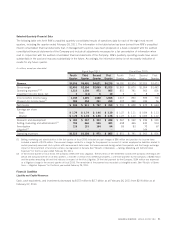
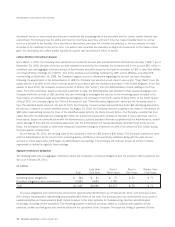
Selected Quarterly Financial Data
The following table sets forth RIM’s unaudited quarterly consolidated results of operations data for each of the eight most recent
quarters, including the quarter ended February 26, 2011. The information in the table below has been derived from RIM’s unaudited
interim consolidated financial statements that, in management’s opinion, have been prepared on a basis consistent with the audited
consolidated financial statements of the Company and include all adjustments necessary for a fair presentation of information when
read in conjunction with the audited consolidated financial statements of the Company. RIM’s quarterly operating results have varied
substantially in the past and may vary substantially in the future. Accordingly, the information below is not necessarily indicative of
results for any future quarter.
(in millions, except per share data)
Fourth
Quarter
Third
Quarter
Second
Quarter
First
Quarter
Fourth
Quarter
Third
Quarter
Second
Quarter
First
Quarter
Fiscal Year 2011 Fiscal Year 2010
Revenue $5,556 $5,495 $4,621 $4,235 $4,080 $3,924 $3,526 $3,423
Gross margin $2,453 $2,394 $2,055 $1,923 $1,863 $1,675 $1,554 $1,492
Operating expenses
(1)(2)
1,213 1,138 973 865 851 791 903 801
Investment income (loss), net 3 (11) 6 10 5689
Income before income taxes 1,243 1,245 1,088 1,068 1,017 890 659 700
Provision for income taxes
(1)
309 334 291 299 307 262 184 56
Net income $ 934 $ 911 $ 797 $ 769 $ 710 $ 628 $ 475 $ 644
Earnings per share
Basic $ 1.79 $ 1.74 $ 1.46 $ 1.39 $ 1.27 $ 1.11 $ 0.84 $ 1.13
Diluted $ 1.78 $ 1.74 $ 1.46 $ 1.38 $ 1.27 $ 1.10 $ 0.83 $ 1.12
Research and development $ 383 $ 357 $ 323 $ 288 $ 267 $ 242 $ 236 $ 220
Selling, marketing and administration
(1)
705 666 546 483 498 466 430 514
Amortization 125 115 104 94 86 83 73 67
Litigation
(2)
––––– – 164 –
Operating expenses $1,213 $1,138 $ 973 $ 865 $ 851 $ 791 $ 903 $ 801
(1) Selling, marketing and administration in the first quarter of fiscal 2010 included unusual charges of $96 million and provision for income taxes
included a benefit of $175 million. The unusual charges related to a charge for the payment on account of certain employee tax liabilities related to
certain previously exercised stock options with measurement date issues that were exercised during certain time periods and the foreign exchange
impact of the enactment of functional currency tax legislation in Canada. See “Results of Operations — Selling, Marketing and Administration
Expenses” for the fiscal year ended February 26, 2011.
(2) In the second quarter of fiscal 2010, the Company settled the Visto Litigation. The key terms of the settlement involved the Company receiving a per-
petual and fully-paid license on all Visto patents, a transfer of certain Visto intellectual property, a one-time payment by the Company of $268 million
and the parties executing full and final releases in respect of the Visto Litigation. Of the total payment by the Company, $164 million was expensed
as a litigation charge in the second quarter of fiscal 2010. The remainder of the payment was recorded as intangible assets. See “Results of Opera-
tions — Litigation Expense” for the fiscal year ended February 26, 2011.
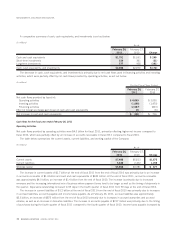
Financial Condition
Liquidity and Capital Resources
Cash, cash equivalents, and investments decreased by $172 million to $2.7 billion as at February 26, 2011 from $2.9 billion as at
February 27, 2010.
RESEARCH IN MOTION ANNUAL REPORT 2011 31