Blackberry 2011 Annual Report Download - page 84
Download and view the complete annual report
Please find page 84 of the 2011 Blackberry annual report below. You can navigate through the pages in the report by either clicking on the pages listed below, or by using the keyword search tool below to find specific information within the annual report.-
 1
1 -
2
-
3
-
4
-
5
-
6
-
7
-
8
-
9
-
10
-
11
-
12
-
13
-
14
-
15
-
16
-
17
-
18
-
19
-
20
-
21
-
22
-
23
-
24
-
25
-
26
-
27
-
28
-
29
-
30
-
31
-
32
-
33
-
34
-
35
-
36
-
37
-
38
-
39
-
40
-
41
-
42
-
43
-
44
-
45
-
46
-
47
-
48
-
49
-
50
-
51
-
52
-
53
-
54
-
55
-
56
-
57
-
58
-
59
-
60
-
61
-
62
-
63
-
64
-
65
-
66
-
67
-
68
-
69
-
70
-
71
-
72
-
73
-
 74
74 -
 75
75 -
 76
76 -
 77
77 -
 78
78 -
 79
79 -
 80
80 -
 81
81 -
 82
82 -
 83
83 -
 84
84 -
 85
85 -
 86
86 -
 87
87 -
 88
88 -
 89
89 -
 90
90 -
 91
91 -
 92
92 -
 93
93 -
 94
94 -
95
 |
 |
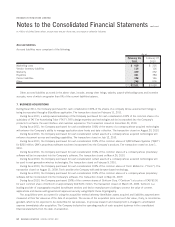
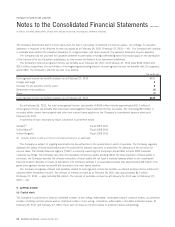
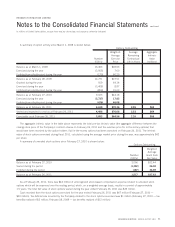
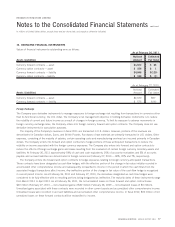
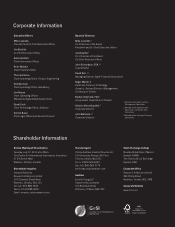
A summary of option activity since March 1, 2008 is shown below:
Number
(000’s)
Weighted-
Average
Exercise
Price
Average
Remaining
Contractual
Life in Years
Aggregate
Intrinsic
Value
(millions)
Options Outstanding
Balance as at March 1, 2008 16,466 $28.66
Exercised during the year (3,565) 7.60
Forfeited/cancelled/expired during the year (170) 60.25
Balance as at February 28, 2009 12,731 $27.51
Granted during the year 559 64.14
Exercised during the year (3,408) 8.87
Forfeited/cancelled/expired during the year (859) 15.03
Balance as at February 27, 2010 9,023 $44.18
Exercised during the year (3,737) 17.83
Forfeited/cancelled/expired during the year (676) 46.08
Balance as at February 26, 2011 4,610 $70.36 2.55 $65
Vested and expected to vest as at February 26, 2011 4,496 $70.06 2.53 $64
Exercisable as at February 26, 2011 3,093 $64.56 2.26 $55
The aggregate intrinsic value in the table above represents the total pre-tax intrinsic value (the aggregate difference between the
closing stock price of the Company’s common shares on February 26, 2011 and the exercise price for in-the-money options) that
would have been received by the option holders if all in-the-money options had been exercised on February 26, 2011. The intrinsic
value of stock options exercised during fiscal 2011, calculated using the average market price during the year, was approximately $42
per share.
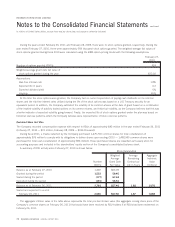
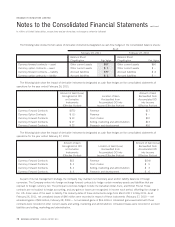
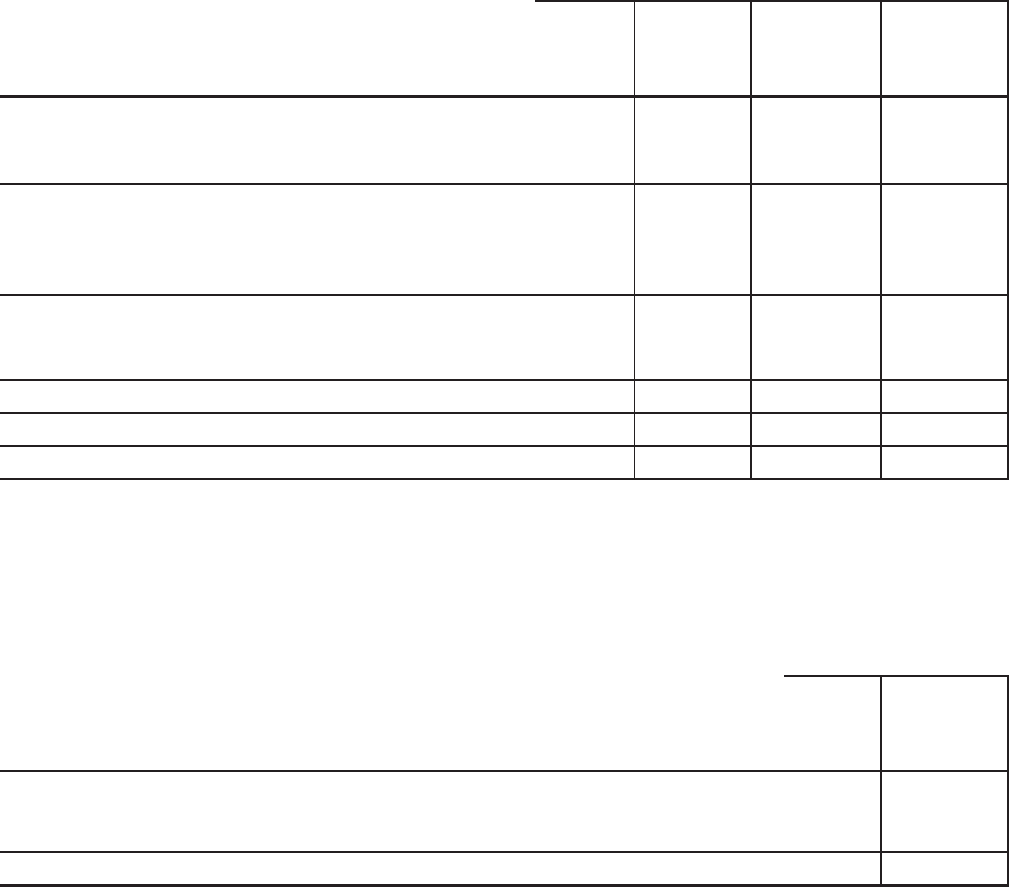
A summary of unvested stock options since February 27, 2010 is shown below:
Number
(000’s)
Weighted
Average
Grant Date
Fair Value
Options Outstanding
Balance as at February 27, 2010 3,056 $32.44
Vested during the period (1,352) 26.30
Forfeited during the period (187) 34.69
Balance as at February 26, 2011 1,517 $37.63
As at February 26, 2011, there was $44 million of unrecognized stock-based compensation expense related to unvested stock
options which will be expensed over the vesting period, which, on a weighted-average basis, results in a period of approximately
1.5 years. The total fair value of stock options vested during the year ended February 26, 2011 was $36 million.
Cash received from the stock options exercised for the year ended February 26, 2011 was $67 million (February 27, 2010 —
$30 million). Tax deficiencies incurred by the Company related to the stock options exercised was $1 million (February 27, 2010 — tax
benefits realized of $2 million; February 28, 2009 — tax benefits realized of $13 million).
RESEARCH IN MOTION ANNUAL REPORT 2011 71
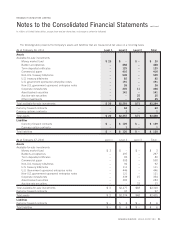
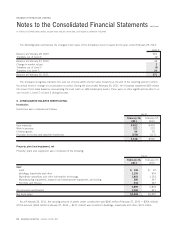
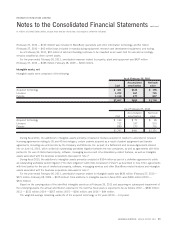
RESEARCH IN MOTION LIMITED
Notes to the Consolidated Financial Statements
continued
In millions of United States dollars, except share and per share data, and except as otherwise indicated