Blackberry 2011 Annual Report Download - page 45
Download and view the complete annual report
Please find page 45 of the 2011 Blackberry annual report below. You can navigate through the pages in the report by either clicking on the pages listed below, or by using the keyword search tool below to find specific information within the annual report.-
 1
1 -
2
-
3
-
4
-
5
-
6
-
7
-
8
-
9
-
10
-
11
-
12
-
13
-
14
-
15
-
16
-
17
-
18
-
19
-
20
-
21
-
22
-
23
-
24
-
25
-
26
-
27
-
28
-
29
-
30
-
31
-
32
-
33
-
34
-
 35
35 -
 36
36 -
 37
37 -
 38
38 -
 39
39 -
 40
40 -
 41
41 -
 42
42 -
 43
43 -
 44
44 -
 45
45 -
 46
46 -
 47
47 -
 48
48 -
 49
49 -
 50
50 -
 51
51 -
 52
52 -
 53
53 -
 54
54 -
 55
55 -
56
-
57
-
58
-
59
-
60
-
61
-
62
-
63
-
64
-
65
-
66
-
67
-
68
-
69
-
70
-
71
-
72
-
73
-
74
-
75
-
76
-
77
-
78
-
79
-
80
-
81
-
82
-
83
-
84
-
85
-
86
-
87
-
88
-
89
-
90
-
91
-
92
-
93
-
94
-
95
 |
 |

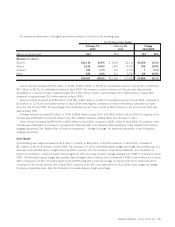
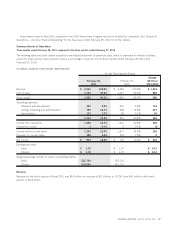
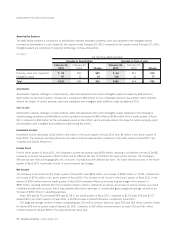
A comparative summary of cash, cash equivalents, and investments is set out below:
(in millions)
February 26,
2011
February 27,
2010 Change
As at
Cash and cash equivalents $1,791 $1,551 $240
Short-term investments 330 361 (31)
Long-term investments 577 958 (381)
Cash, cash equivalents, and investments $2,698 $2,870 $(172)
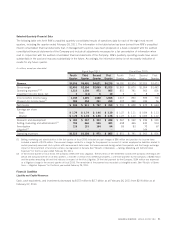
The decrease in cash, cash equivalents, and investments is primarily due to net cash flows used in financing activities and investing
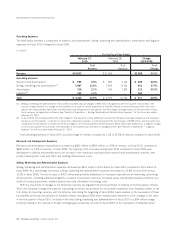
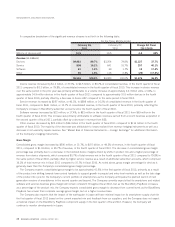
activities, which were partially offset by net cash flows provided by operating activities, as set out below:
(in millions)
February 26,
2011
February 27,
2010
For the Fiscal Year Ended
Net cash flows provided by (used in):
Operating activities $ 4,009 $ 3,035
Investing activities (1,698) (1,470)
Financing activities (2,087) (843)
Effect of foreign exchange gain (loss) on cash and cash equivalents 16 (6)
Net increase in cash and cash equivalents $ 240 $716
Cash flows for the fiscal year ended February 26, 2011
Operating Activities
Net cash flows provided by operating activities were $4.0 billion for fiscal 2011, primarily reflecting higher net income compared to
fiscal 2010, which was partially offset by an increase in accounts receivable in fiscal 2011 compared to fiscal 2010.
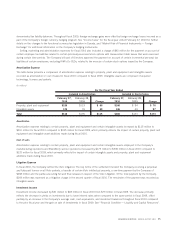
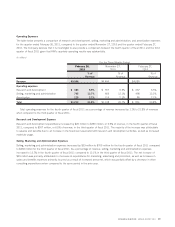
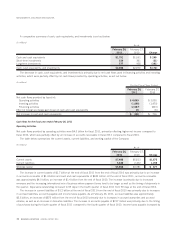
The table below summarizes the current assets, current liabilities, and working capital of the Company:
(in millions)
February 26,
2011
February 27,
2010 Change
As at
Current assets $7,488 $5,813 $1,675
Current liabilities 3,630 2,432 1,198
Working capital $3,858 $3,381 $477
The increase in current assets of $1.7 billion at the end of fiscal 2011 from the end of fiscal 2010 was primarily due to an increase
in accounts receivable of $1.4 billion and cash and cash equivalents of $240 million. At the end of fiscal 2011, accounts receivable
was approximately $4.0 billion, an increase of $1.4 billion from the end of fiscal 2010. The increase is primarily due to increased
revenues and the increasing international mix of business where payment terms tend to be longer as well as the timing of shipments in
the quarter. Days sales outstanding increased to 65 days in the fourth quarter of fiscal 2011 from 58 days at the end of fiscal 2010.
The increase in current liabilities of $1.2 billion at the end of fiscal 2011 from the end of fiscal 2010 was primarily due to increases
in accrued liabilities, accounts payable and income taxes payable. As at February 26, 2011, accrued liabilities was approximately
$2.5 billion, an increase of $873 million from the end of fiscal 2010 primarily due to increases in accrued warranties and accrued
rebates, as well as an increase in derivative liabilities. The increase in accounts payable of $217 million was primarily due to the timing
of purchases during the fourth quarter of fiscal 2011 compared to the fourth quarter of fiscal 2010. Income taxes payable increased by
32 RESEARCH IN MOTION ANNUAL REPORT 2011
MANAGEMENT’S DISCUSSION AND ANALYSIS