Blackberry 2011 Annual Report Download - page 61
Download and view the complete annual report
Please find page 61 of the 2011 Blackberry annual report below. You can navigate through the pages in the report by either clicking on the pages listed below, or by using the keyword search tool below to find specific information within the annual report.-
 1
1 -
2
-
3
-
4
-
5
-
6
-
7
-
8
-
9
-
10
-
11
-
12
-
13
-
14
-
15
-
16
-
17
-
18
-
19
-
20
-
21
-
22
-
23
-
24
-
25
-
26
-
27
-
28
-
29
-
30
-
31
-
32
-
33
-
34
-
35
-
36
-
37
-
38
-
39
-
40
-
41
-
42
-
43
-
44
-
45
-
46
-
47
-
48
-
49
-
50
-
 51
51 -
 52
52 -
 53
53 -
 54
54 -
 55
55 -
 56
56 -
 57
57 -
 58
58 -
 59
59 -
 60
60 -
 61
61 -
 62
62 -
 63
63 -
 64
64 -
 65
65 -
 66
66 -
 67
67 -
 68
68 -
 69
69 -
 70
70 -
 71
71 -
72
-
73
-
74
-
75
-
76
-
77
-
78
-
79
-
80
-
81
-
82
-
83
-
84
-
85
-
86
-
87
-
88
-
89
-
90
-
91
-
92
-
93
-
94
-
95
 |
 |

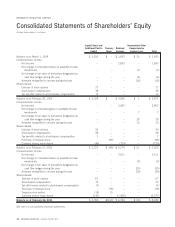
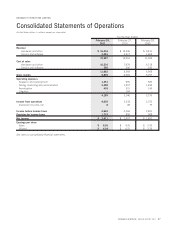
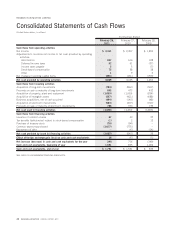
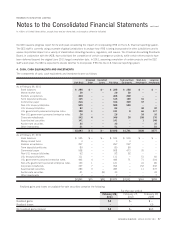
RESEARCH IN MOTION LIMITED
Consolidated Statements of Cash Flows
(United States dollars, in millions)
February 26,
2011
February 27,
2010
February 28,
2009
For the Year Ended
Cash flows from operating activities
Net income $ 3,411 $ 2,457 $ 1,893
Adjustments to reconcile net income to net cash provided by operating
activities:
Amortization 927 616 328
Deferred income taxes 92 51 (37)
Income taxes payable 25(7)
Stock-based compensation 72 58 38
Other 196
Net changes in working capital items (496) (161) (769)
Net cash provided by operating activities 4,009 3,035 1,452
Cash flows from investing activities
Acquisition of long-term investments (784) (863) (507)
Proceeds on sale or maturity of long-term investments 893 473 432
Acquisition of property, plant and equipment (1,039) (1,009) (834)
Acquisition of intangible assets (557) (421) (688)
Business acquisitions, net of cash acquired (494) (143) (48)
Acquisition of short-term investments (503) (477) (917)
Proceeds on sale or maturity of short-term investments 786 970 739
Net cash used in investing activities (1,698) (1,470) (1,823)
Cash flows from financing activities
Issuance of common shares 67 30 27
Tax benefits (deficiencies) related to stock-based compensation (1) 212
Purchase of treasury stock (76) (94) –
Common shares repurchased (2,077) (775) –
Repayment of debt –(6) (14)
Net cash provided by (used in) financing activities (2,087) (843) 25
Effect of foreign exchange gain (loss) on cash and cash equivalents 16 (6) (3)
Net increase (decrease) in cash and cash equivalents for the year 240 716 (349)
Cash and cash equivalents, beginning of year 1,551 835 1,184
Cash and cash equivalents, end of year $ 1,791 $ 1,551 $ 835
See notes to consolidated financial statements.
48 RESEARCH IN MOTION ANNUAL REPORT 2011