Blackberry 2011 Annual Report Download - page 42
Download and view the complete annual report
Please find page 42 of the 2011 Blackberry annual report below. You can navigate through the pages in the report by either clicking on the pages listed below, or by using the keyword search tool below to find specific information within the annual report.-
 1
1 -
2
-
3
-
4
-
5
-
6
-
7
-
8
-
9
-
10
-
11
-
12
-
13
-
14
-
15
-
16
-
17
-
18
-
19
-
20
-
21
-
22
-
23
-
24
-
25
-
26
-
27
-
28
-
29
-
30
-
31
-
 32
32 -
 33
33 -
 34
34 -
 35
35 -
 36
36 -
 37
37 -
 38
38 -
 39
39 -
 40
40 -
 41
41 -
 42
42 -
 43
43 -
 44
44 -
 45
45 -
 46
46 -
 47
47 -
 48
48 -
 49
49 -
 50
50 -
 51
51 -
 52
52 -
53
-
54
-
55
-
56
-
57
-
58
-
59
-
60
-
61
-
62
-
63
-
64
-
65
-
66
-
67
-
68
-
69
-
70
-
71
-
72
-
73
-
74
-
75
-
76
-
77
-
78
-
79
-
80
-
81
-
82
-
83
-
84
-
85
-
86
-
87
-
88
-
89
-
90
-
91
-
92
-
93
-
94
-
95
 |
 |

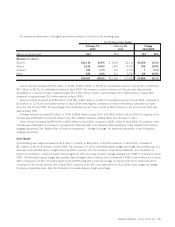
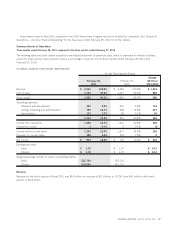
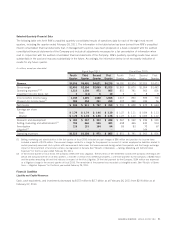
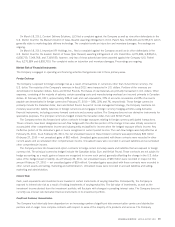
Operating Expenses
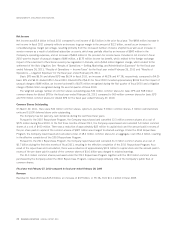
The table below presents a comparison of research and development, selling, marketing and administration, and amortization expenses
for the quarter ended February 26, 2011, compared to the quarter ended November 27, 2010 and the quarter ended February 27,
2010. The Company believes that it is meaningful to also provide a comparison between the fourth quarter of fiscal 2011 and the third
quarter of fiscal 2011 given that RIM’s quarterly operating results vary substantially.
(in millions)
%of
Revenue
%of
Revenue
%of
Revenue
February 26,
2011
November 27,
2010
February 27,
2010
For the Three Months Ended
Revenue $5,556 $5,495 $4,080
Operating expenses
Research and development $ 383 6.9% $ 357 6.5% $ 267 6.5%
Selling, marketing and administration 705 12.7% 666 12.1% 498 12.2%
Amortization 125 2.2% 115 2.1% 86 2.1%
Total $1,213 21.8% $1,138 20.7% $ 851 20.8%
Total operating expenses for the fourth quarter of fiscal 2011 as a percentage of revenue increased by 1.1% to 21.8% of revenues
when compared to the third quarter of fiscal 2011.
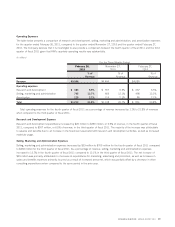
Research and Development Expense
Research and development expenditures increased by $26 million to $383 million, or 6.9% of revenue, in the fourth quarter of fiscal
2011, compared to $357 million, or 6.5% of revenue, in the third quarter of fiscal 2011. The majority of the increase was attributable
to salaries and benefits due to an increase in the headcount associated with research and development activities, as well as increased
materials usage.
Selling, Marketing and Administration Expenses
Selling, marketing and administration expenses increased by $39 million to $705 million for the fourth quarter of fiscal 2011 compared
to $666 million for the third quarter of fiscal 2011. As a percentage of revenue, selling, marketing and administration expenses
increased to 12.7% in the fourth quarter of fiscal 2011 compared to 12.1% in the third quarter of fiscal 2011. The net increase of
$39 million was primarily attributable to increases in expenditures for marketing, advertising and promotion, as well as increases in
salary and benefits expenses primarily incurred as a result of increased personnel, which was partially offset by a decrease in other
consulting expenditures when compared to the same period in the prior year.
RESEARCH IN MOTION ANNUAL REPORT 2011 29