Blackberry 2011 Annual Report Download - page 40
Download and view the complete annual report
Please find page 40 of the 2011 Blackberry annual report below. You can navigate through the pages in the report by either clicking on the pages listed below, or by using the keyword search tool below to find specific information within the annual report.-
 1
1 -
2
-
3
-
4
-
5
-
6
-
7
-
8
-
9
-
10
-
11
-
12
-
13
-
14
-
15
-
16
-
17
-
18
-
19
-
20
-
21
-
22
-
23
-
24
-
25
-
26
-
27
-
28
-
29
-
 30
30 -
 31
31 -
 32
32 -
 33
33 -
 34
34 -
 35
35 -
 36
36 -
 37
37 -
 38
38 -
 39
39 -
 40
40 -
 41
41 -
 42
42 -
 43
43 -
 44
44 -
 45
45 -
 46
46 -
 47
47 -
 48
48 -
 49
49 -
 50
50 -
51
-
52
-
53
-
54
-
55
-
56
-
57
-
58
-
59
-
60
-
61
-
62
-
63
-
64
-
65
-
66
-
67
-
68
-
69
-
70
-
71
-
72
-
73
-
74
-
75
-
76
-
77
-
78
-
79
-
80
-
81
-
82
-
83
-
84
-
85
-
86
-
87
-
88
-
89
-
90
-
91
-
92
-
93
-
94
-
95
 |
 |

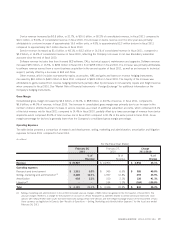
Repurchases made in fiscal 2011 pursuant to the 2010 Repurchase Program resulted in its effective completion. See “Results of
Operations — Common Shares Outstanding” for the fiscal year ended February 26, 2011 for further details.
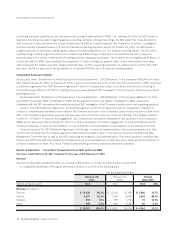
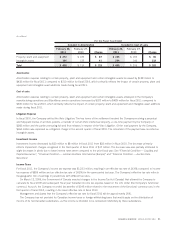
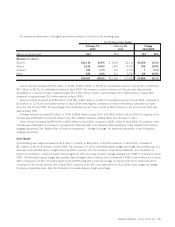
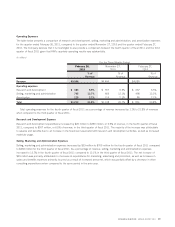
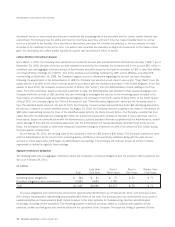
Summary Results of Operations
Three months ended February 26, 2011 compared to the three months ended February 27, 2010
The following table sets forth certain unaudited consolidated statement of operations data, which is expressed in millions of dollars,
except for share and per share amounts and as a percentage of revenue, for the three months ended February 26, 2011 and
February 27, 2010:
(in millions, except for share and per share amounts)
February 26,
2011
February 27,
2010
Change
Q4 Fiscal
2011/2010
For the Three Months Ended
Revenue $ 5,556 100.0% $ 4,080 100.0% $ 1,476
Cost of sales 3,103 55.8% 2,217 54.3% 886
Gross margin 2,453 44.2% 1,863 45.7% 590
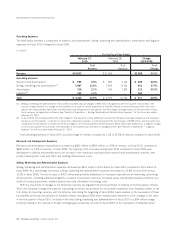
Operating expenses
Research and development 383 6.9% 267 6.5% 116
Selling, marketing and administration 705 12.7% 498 12.2% 207
Amortization 125 2.2% 86 2.1% 39
1,213 21.8% 851 20.8% 362
Income from operations 1,240 22.3% 1,012 24.8% 228
Investment income 3 0.1% 5 0.1% (2)
Income before income taxes 1,243 22.4% 1,017 24.9% 226
Provision for income taxes 309 5.6% 307 7.5% 2
Net income $ 934 16.8% $ 710 17.4% $224
Earnings per share
Basic $ 1.79 $ 1.27 $ 0.52
Diluted $ 1.78 $ 1.27 $ 0.51
Weighted-average number of shares outstanding (000’s)
Basic 522,764 557,114
Diluted 524,334 561,130
Revenue
Revenue for the fourth quarter of fiscal 2011 was $5.6 billion, an increase of $1.5 billion, or 36.2%, from $4.1 billion in the fourth
quarter of fiscal 2010.
RESEARCH IN MOTION ANNUAL REPORT 2011 27