Blackberry 2011 Annual Report Download - page 41
Download and view the complete annual report
Please find page 41 of the 2011 Blackberry annual report below. You can navigate through the pages in the report by either clicking on the pages listed below, or by using the keyword search tool below to find specific information within the annual report.-
 1
1 -
2
-
3
-
4
-
5
-
6
-
7
-
8
-
9
-
10
-
11
-
12
-
13
-
14
-
15
-
16
-
17
-
18
-
19
-
20
-
21
-
22
-
23
-
24
-
25
-
26
-
27
-
28
-
29
-
30
-
 31
31 -
 32
32 -
 33
33 -
 34
34 -
 35
35 -
 36
36 -
 37
37 -
 38
38 -
 39
39 -
 40
40 -
 41
41 -
 42
42 -
 43
43 -
 44
44 -
 45
45 -
 46
46 -
 47
47 -
 48
48 -
 49
49 -
 50
50 -
 51
51 -
52
-
53
-
54
-
55
-
56
-
57
-
58
-
59
-
60
-
61
-
62
-
63
-
64
-
65
-
66
-
67
-
68
-
69
-
70
-
71
-
72
-
73
-
74
-
75
-
76
-
77
-
78
-
79
-
80
-
81
-
82
-
83
-
84
-
85
-
86
-
87
-
88
-
89
-
90
-
91
-
92
-
93
-
94
-
95
 |
 |

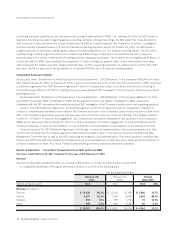
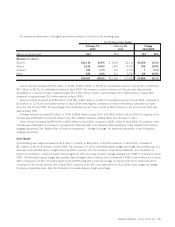
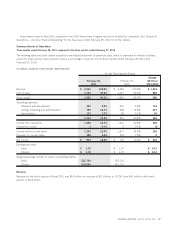
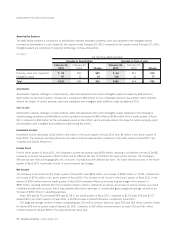
A comparative breakdown of the significant revenue streams is set forth in the following table:
February 26,
2011
February 27,
2010
Change Q4 Fiscal
2011/2010
For the Three Months Ended
Millions of devices sold 14.9 10.5 4.4 42%
Revenue (in millions)
Devices $4,481 80.7% $3,254 79.8% $1,227 37.7%
Service 898 16.2% 641 15.7% 257 40.1%
Software 81 1.5% 69 1.7% 12 17.4%
Other 96 1.6% 116 2.8% (20) (17.2%)
$5,556 100.0% $4,080 100.0% $1,476 36.2%
Device revenue increased by $1.2 billion, or 37.7%, to $4.5 billion, or 80.7% of consolidated revenue, in the fourth quarter of fiscal
2011 compared to $3.3 billion, or 79.8%, of consolidated revenue in the fourth quarter of fiscal 2010. This increase in device revenue
over the same period in the prior year was primarily attributable to a volume increase of approximately 4.4 million units, or 42%, to
approximately 14.9 million devices in the fourth quarter of fiscal 2011 compared to approximately 10.5 million devices in the fourth
quarter of fiscal 2010, partially offset by a decrease in device ASP compared to the same period in fiscal 2010.
Service revenue increased by $257 million, or 40.1%, to $898 million, or 16.2% of consolidated revenue in the fourth quarter of
fiscal 2011, compared to $641 million, or 15.7% of consolidated revenue, in the fourth quarter of fiscal 2010, primarily reflecting the
Company’s increase in BlackBerry subscriber accounts since the fourth quarter of fiscal 2010.
Software revenue increased by $12 million, or 17.4%, to $81 million in the fourth quarter of fiscal 2011 from $69 million in the
fourth quarter of fiscal 2010. This increase was primarily attributable to software revenues earned from a recent business acquisition in
the second quarter of fiscal 2011, partially offset by a decrease in revenue from BES.
Other revenue decreased by $20 million to $96 million in the fourth quarter of fiscal 2011 compared to $116 million in the fourth
quarter of fiscal 2010. The majority of the decrease was attributable to losses realized from revenue hedging instruments as well as a
decrease in non-warranty repairs revenue. See “Market Risk of Financial Instruments — Foreign Exchange” for additional information
on the Company’s hedging instruments.
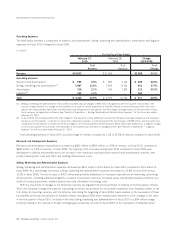
Gross Margin
Consolidated gross margin increased by $590 million, or 31.7%, to $2.5 billion, or 44.2% of revenue, in the fourth quarter of fiscal
2011, compared to $1.9 billion, or 45.7% of revenue, in the fourth quarter of fiscal 2010. The decrease in consolidated gross margin
percentage was primarily due to a decrease in the blended device margins driven by shifts in product mix and a higher percentage of
revenue from device shipments, which comprised 80.7% of total revenue mix in the fourth quarter of fiscal 2011 compared to 79.8% in
the same period of fiscal 2010, partially offset by higher service revenue as a result of additional subscriber accounts, which comprised
16.2% of total revenue mix in fiscal 2011 compared to 15.7% in fiscal 2010. As noted above, gross margin percentage for devices is
generally lower than the Company’s consolidated gross margin percentage.
The Company expects consolidated gross margin to be approximately 41.5% in the first quarter of fiscal 2012, primarily as a result
of the product mix shifting towards lower priced handsets to support growth in prepaid and entry level markets as well as the late stage
of the product life cycle for the Company’s current portfolio of smartphones as the Company anticipates the planned launch of next
generation versions of smartphones in the second quarter and beyond. The Company currently expects that its smartphone and related
software and services business gross margin will remain consistent throughout fiscal 2012, but as the BlackBerry PlayBook increases
as a percentage of the product mix, the Company expects consolidated gross margin to decrease from current levels as the BlackBerry
PlayBook has a lower than corporate average gross margin, but on a higher revenue base.
The Company also expects that the impact of the earthquake in Japan will have minimal impact on its smartphone supply chain for
the first quarter of fiscal 2012 based on the current expected mix and feedback from our suppliers, and the Company does not expect
a material impact on the BlackBerry PlayBook component supply in the first quarter of fiscal 2012. However, the Company will
continue to monitor developments in Japan.
28 RESEARCH IN MOTION ANNUAL REPORT 2011
MANAGEMENT’S DISCUSSION AND ANALYSIS