Advance Auto Parts 2014 Annual Report Download - page 91
Download and view the complete annual report
Please find page 91 of the 2014 Advance Auto Parts annual report below. You can navigate through the pages in the report by either clicking on the pages listed below, or by using the keyword search tool below to find specific information within the annual report.-
 1
1 -
2
-
3
-
4
-
5
-
6
-
7
-
8
-
9
-
10
-
11
-
12
-
13
-
14
-
15
-
16
-
17
-
18
-
19
-
20
-
21
-
22
-
23
-
24
-
25
-
26
-
27
-
28
-
29
-
30
-
31
-
32
-
33
-
34
-
35
-
36
-
37
-
38
-
39
-
40
-
41
-
42
-
43
-
44
-
45
-
46
-
47
-
48
-
49
-
50
-
51
-
52
-
53
-
54
-
55
-
56
-
57
-
58
-
59
-
60
-
61
-
62
-
63
-
64
-
65
-
66
-
67
-
68
-
69
-
70
-
71
-
72
-
73
-
74
-
75
-
76
-
77
-
78
-
79
-
80
-
 81
81 -
 82
82 -
 83
83 -
 84
84 -
 85
85 -
 86
86 -
 87
87 -
 88
88 -
 89
89 -
 90
90 -
 91
91 -
 92
92 -
 93
93 -
 94
94 -
 95
95 -
 96
96 -
 97
97 -
 98
98 -
 99
99 -
 100
100
 |
 |

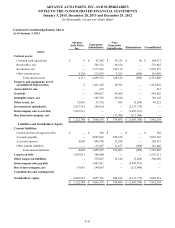
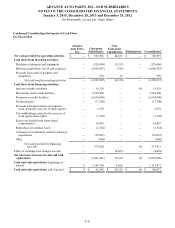
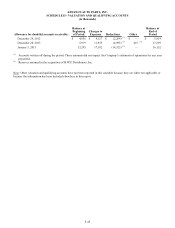
ADVANCE AUTO PARTS, INC. AND SUBSIDIARIES
NOTES TO THE CONSOLIDATED FINANCIAL STATEMENTS
January 3, 2015, December 28, 2013 and December 29, 2012
(in thousands, except per share data)
F-44
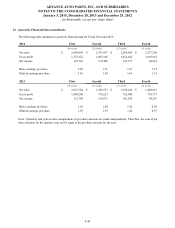
23. Quarterly Financial Data (unaudited):
The following table summarizes quarterly financial data for Fiscal 2014 and 2013:
2014 First Second Third Fourth
(16 weeks) (12 weeks) (12 weeks) (13 weeks)
Net sales $ 2,969,499 $ 2,347,697 $ 2,289,456 $ 2,237,209
Gross profit 1,353,122 1,062,108 1,034,442 1,003,941
Net income 147,726 139,488 122,177 84,434
Basic earnings per share 2.02 1.91 1.67 1.15
Diluted earnings per share 2.01 1.89 1.66 1.15
2013 First Second Third Fourth
(16 weeks) (12 weeks) (12 weeks) (12 weeks)
Net sales $ 2,015,304 $ 1,549,553 $ 1,520,144 $ 1,408,813
Gross profit 1,008,206 779,223 762,940 701,777
Net income 121,790 116,871 103,830 49,267
Basic earnings per share 1.66 1.60 1.42 0.68
Diluted earnings per share 1.65 1.59 1.42 0.67
Note: Quarterly and year-to-date computations of per share amounts are made independently. Therefore, the sum of per
share amounts for the quarters may not be equal to the per share amount for the year.