Advance Auto Parts 2014 Annual Report Download - page 33
Download and view the complete annual report
Please find page 33 of the 2014 Advance Auto Parts annual report below. You can navigate through the pages in the report by either clicking on the pages listed below, or by using the keyword search tool below to find specific information within the annual report.-
 1
1 -
2
-
3
-
4
-
5
-
6
-
7
-
8
-
9
-
10
-
11
-
12
-
13
-
14
-
15
-
16
-
17
-
18
-
19
-
20
-
21
-
22
-
 23
23 -
 24
24 -
 25
25 -
 26
26 -
 27
27 -
 28
28 -
 29
29 -
 30
30 -
 31
31 -
 32
32 -
 33
33 -
 34
34 -
 35
35 -
 36
36 -
 37
37 -
 38
38 -
 39
39 -
 40
40 -
 41
41 -
 42
42 -
 43
43 -
44
-
45
-
46
-
47
-
48
-
49
-
50
-
51
-
52
-
53
-
54
-
55
-
56
-
57
-
58
-
59
-
60
-
61
-
62
-
63
-
64
-
65
-
66
-
67
-
68
-
69
-
70
-
71
-
72
-
73
-
74
-
75
-
76
-
77
-
78
-
79
-
80
-
81
-
82
-
83
-
84
-
85
-
86
-
87
-
88
-
89
-
90
-
91
-
92
-
93
-
94
-
95
-
96
-
97
-
98
-
99
-
100
 |
 |

26
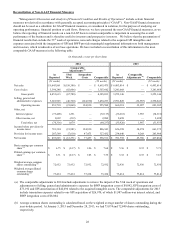
SG&A Expenses
SG&A expenses for 2014 were $3,601.9 million, or 36.6% of net sales, as compared to $2,591.8 million, or 39.9% of net
sales, for 2013, a decrease of 332 basis points. The primary driver of the net decrease in SG&A expenses, as a percentage of net
sales, was the result of the acquired GPI business having a lower SG&A cost structure. Partially offsetting this decrease were
$73.2 million, or 74 basis points, of GPI integration expenses, $42.7 million, or 43 basis points, of amortization of acquired
GPI intangible assets and $9.0 million, or 9 basis points, of BWP integration expenses.
Operating Income
Operating income for 2014 was $851.7 million, representing 8.7% of net sales, as compared to $660.3 million, or 10.2% of
net sales, for 2013, a decrease of 152 basis points. This decrease was due to a lower gross profit rate partially offset by a lower
SG&A rate. These decreases on a rate basis were due to the gross profit and SG&A drivers previously discussed.
Interest Expense
Interest expense for 2014 was $73.4 million, or 0.7% of net sales, as compared to $36.6 million, or 0.6% of net sales, in
2013. The increase in interest expense was due to additional borrowings related to the GPI acquisition.
Income Taxes
Income tax expense for 2014 was $287.6 million, as compared to $234.6 million for 2013. Our effective income tax rate
was 36.8% and 37.5% for 2014 and 2013, respectively. Our income tax rate in 2014 was lower than the prior year primarily due
to certain non-deductible costs related to the GPI acquisition that increased the rate in 2013. Our income tax rates in both 2014
and 2013 reflect favorable income tax settlements and statute of limitation expirations.
Net Income
Net income was $493.8 million, or $6.71 per diluted share, for 2014 as compared to $391.8 million, or $5.32 per diluted
share, for 2013. As a percentage of net sales, net income for 2014 was 5.0%, as compared to 6.0% for 2013. The increase in
diluted EPS was driven primarily by the increase in net income.
2013 Compared to 2012
Net Sales
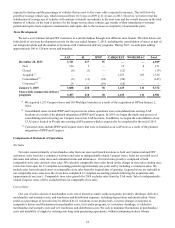
Net sales for 2013 were $6,493.8 million, an increase of $288.8 million, or 4.7%, over net sales for 2012. This growth was
primarily due to sales from the acquired BWP stores and sales from the new AAP and AI stores added within 2013 partially
offset by a 1.5% decrease in comparable store sales. The comparable store sales decrease was driven by a decrease in
transaction count partially offset by an increase in transaction value despite more promotional activity in response to lower
customer demand. The increase in transaction value was primarily due to (i) the gradual increase in cost and complexity of
automotive parts and commodity prices and (ii) the positive impact from a higher mix of Commercial sales.
2013 2012
Comparable Store Sales % (1.5)% (0.8)%
Net Stores Added (excluding BWP stores) 151 132
Gross Profit
Gross profit for 2013 was $3,252.1 million, or 50.1% of net sales, as compared to $3,098.0 million, or 49.9% of net sales,
in 2012, an increase of 15 basis points. The increase in gross profit as a percentage of net sales was driven by increased
merchandise margins, due to lower acquisition costs and a favorable product mix, and improvement in shrink partially offset by
planned inefficiencies in supply chain costs associated with the ramp-up in shipments of inventory from our new distribution
center and the impact from a higher mix of Commercial sales which have a lower gross profit rate. The increase in our
Commercial mix of sales was primarily due to the sales from the acquired BWP stores.