Advance Auto Parts 2014 Annual Report Download - page 37
Download and view the complete annual report
Please find page 37 of the 2014 Advance Auto Parts annual report below. You can navigate through the pages in the report by either clicking on the pages listed below, or by using the keyword search tool below to find specific information within the annual report.-
 1
1 -
2
-
3
-
4
-
5
-
6
-
7
-
8
-
9
-
10
-
11
-
12
-
13
-
14
-
15
-
16
-
17
-
18
-
19
-
20
-
21
-
22
-
23
-
24
-
25
-
26
-
 27
27 -
 28
28 -
 29
29 -
 30
30 -
 31
31 -
 32
32 -
 33
33 -
 34
34 -
 35
35 -
 36
36 -
 37
37 -
 38
38 -
 39
39 -
 40
40 -
 41
41 -
 42
42 -
 43
43 -
 44
44 -
 45
45 -
 46
46 -
 47
47 -
48
-
49
-
50
-
51
-
52
-
53
-
54
-
55
-
56
-
57
-
58
-
59
-
60
-
61
-
62
-
63
-
64
-
65
-
66
-
67
-
68
-
69
-
70
-
71
-
72
-
73
-
74
-
75
-
76
-
77
-
78
-
79
-
80
-
81
-
82
-
83
-
84
-
85
-
86
-
87
-
88
-
89
-
90
-
91
-
92
-
93
-
94
-
95
-
96
-
97
-
98
-
99
-
100
 |
 |

30
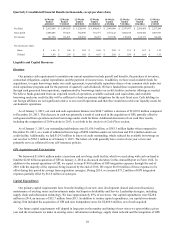
In 2015, we anticipate that our capital expenditures will be approximately $325 million to $340 million. These investments will
primarily include GPI integration expenditures for store conversions and supply chain and systems integration activities; new
store development (leased and owned locations); and investments in our existing stores, supply chain network and systems. We
anticipate opening between 100 to 120 stores and branches during 2015.
Stock Repurchases
We have a stock repurchase program that allows us to repurchase our common stock on the open market or in privately
negotiated transactions from time to time in accordance with the requirements of the SEC. As of January 3, 2015, we had
$415.1 million remaining under our $500 million stock repurchase program authorized by our Board of Directors on May 14,
2012. During 2014, we made no repurchases under the stock repurchase program.
During 2014, we repurchased 34,682 shares of our common stock at an aggregate cost of $5.2 million, or an average price
of $148.85 per share, in connection with the net settlement of shares issued as a result of the vesting of restricted stock or
restricted stock units.
Dividend
Since 2006, our Board of Directors has declared quarterly dividends of $0.06 per share to stockholders of record. On
February 11, 2015, our Board of Directors declared a quarterly dividend of $0.06 per share to be paid on April 3, 2015 to all
common stockholders of record as of March 20, 2015.
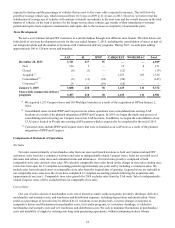
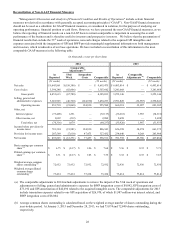
Analysis of Cash Flows
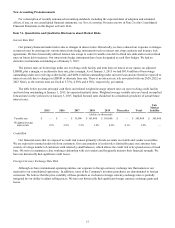
A summary and analysis of our cash flows for 2014, 2013 and 2012 is reflected in the table and following discussion.
Fiscal Year
2014 2013 2012
(in millions)
Cash flows from operating activities $ 709.0 $ 545.3 $ 685.3
Cash flows from investing activities (2,288.2)(362.1)(273.0)
Cash flows from financing activities 575.9 331.2 127.9
Net (decrease) increase in cash and cash
equivalents $ (1,007.8) $ 514.4 $ 540.2
Operating Activities
For 2014, net cash provided by operating activities increased $163.7 million to $709.0 million. This net increase in
operating cash flow was primarily driven by higher net income and non-cash expenses along with an increase in accounts
payable. This was partially offset by a decrease in cash flows from accrued expenses and other assets related to the timing of
payroll and payments to non-merchandise vendors. The benefit from accounts payable was expected as we were able to
integrate terms for certain vendors serving both Carquest and Advance Auto Parts.
For 2013, net cash provided by operating activities decreased $140.0 million to $545.3 million. This net decrease in
operating cash flow was primarily driven by a $206.3 million increase in inventory, net of accounts payable, primarily due to an
increase in inventory related to new stores and other inventory availability initiatives combined with the deceleration in our
accounts payable ratio. Partially offsetting these decreases in operating cash flow was a $57.1 million decrease in the outflow
of cash related to receivables resulting from the transition of our in-house Commercial credit program in 2012 and a $22.4
million increase in accrued expenses related to the timing of payments to vendors.
Investing Activities
For 2014, net cash used in investing activities increased by $1,926.1 million to $2,288.2 million. The increase in cash used
in investing activities was primarily driven by cash used in the acquisition of GPI.
For 2013, net cash used in investing activities increased by $89.1 million to $362.1 million. The increase in cash used in
investing activities was primarily driven by cash used in the acquisition of BWP, partially offset by a reduction in investments