Advance Auto Parts 2014 Annual Report Download - page 32
Download and view the complete annual report
Please find page 32 of the 2014 Advance Auto Parts annual report below. You can navigate through the pages in the report by either clicking on the pages listed below, or by using the keyword search tool below to find specific information within the annual report.-
 1
1 -
2
-
3
-
4
-
5
-
6
-
7
-
8
-
9
-
10
-
11
-
12
-
13
-
14
-
15
-
16
-
17
-
18
-
19
-
20
-
21
-
 22
22 -
 23
23 -
 24
24 -
 25
25 -
 26
26 -
 27
27 -
 28
28 -
 29
29 -
 30
30 -
 31
31 -
 32
32 -
 33
33 -
 34
34 -
 35
35 -
 36
36 -
 37
37 -
 38
38 -
 39
39 -
 40
40 -
 41
41 -
 42
42 -
43
-
44
-
45
-
46
-
47
-
48
-
49
-
50
-
51
-
52
-
53
-
54
-
55
-
56
-
57
-
58
-
59
-
60
-
61
-
62
-
63
-
64
-
65
-
66
-
67
-
68
-
69
-
70
-
71
-
72
-
73
-
74
-
75
-
76
-
77
-
78
-
79
-
80
-
81
-
82
-
83
-
84
-
85
-
86
-
87
-
88
-
89
-
90
-
91
-
92
-
93
-
94
-
95
-
96
-
97
-
98
-
99
-
100
 |
 |

25
requirements, when we believe it is advantageous. Our cost of sales and gross profit rates may not be comparable to that of our
competitors due to differences in industry practice regarding the classification of certain costs and mix of Commercial and DIY
sales. See Note 2, Summary of Significant Accounting Policies, to our Consolidated Financial Statements elsewhere in this
report for additional discussion of these costs.
Selling, General and Administrative Expenses
SG&A expenses consist of store payroll, store occupancy (including rent and depreciation), advertising expenses,
acquisition and integration related expenses, Commercial delivery expenses, other store expenses and general and
administrative expenses, including salaries and related benefits of store support center Team Members, share-based
compensation expenses, store support center administrative office expenses, data processing, professional expenses, self-
insurance costs, depreciation and amortization, closed store expense and impairment charges, if any, and other related expenses.
See Note 2, Summary of Significant Accounting Policies, to our Consolidated Financial Statements for additional discussion of
these costs.
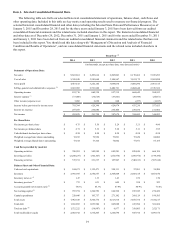
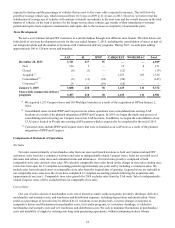
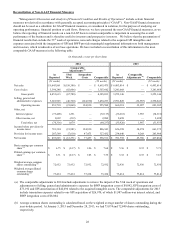
Consolidated Results of Operations
The following table sets forth certain of our operating data expressed as a percentage of net sales for the periods indicated.
Fiscal Year Ended
January 3,
2015
December 28,
2013
December 29,
2012
Net sales 100.0% 100.0% 100.0%
Cost of sales, including purchasing and
warehousing costs 54.8 49.9 50.1
Gross profit 45.2 50.1 49.9
Selling, general and administrative expenses 36.6 39.9 39.3
Operating income 8.7 10.2 10.6
Interest expense (0.7)(0.6)(0.5)
Other, net 0.0 0.0 0.0
Provision for income taxes 2.9 3.6 3.8
Net income 5.0% 6.0% 6.2%
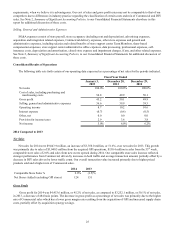
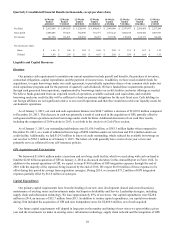
2014 Compared to 2013
Net Sales
Net sales for 2014 were $9,843.9 million, an increase of $3,350.0 million, or 51.6%, over net sales for 2013. This growth
was primarily due to sales of $3,040.5 million from the acquired GPI operations, $150.4 million in sales from the 53rd week,
comparable store sales of 2.0% and sales from new stores opened during 2014. Our comparable store sales increase reflected
stronger performance from Commercial, driven by increases in both traffic and average transaction amount, partially offset by a
decrease in DIY sales driven by lower traffic count. Our overall transaction value increased primarily due to higher priced
products sold and a higher mix of Commercial sales.
2014 2013
Comparable Store Sales % 2.0% (1.5)%
Net Stores Added (excluding GPI stores) 124 151
Gross Profit
Gross profit for 2014 was $4,453.6 million, or 45.2% of net sales, as compared to $3,252.1 million, or 50.1% of net sales,
in 2013, a decrease of 484 basis points. The decrease in gross profit as a percentage of net sales was primarily due to the higher
mix of Commercial sales which has a lower gross margin rate resulting from the acquisition of GPI and increased supply chain
costs, partially offset by acquisition synergy savings.