Advance Auto Parts 2014 Annual Report Download - page 25
Download and view the complete annual report
Please find page 25 of the 2014 Advance Auto Parts annual report below. You can navigate through the pages in the report by either clicking on the pages listed below, or by using the keyword search tool below to find specific information within the annual report.-
 1
1 -
2
-
3
-
4
-
5
-
6
-
7
-
8
-
9
-
10
-
11
-
12
-
13
-
14
-
 15
15 -
 16
16 -
 17
17 -
 18
18 -
 19
19 -
 20
20 -
 21
21 -
 22
22 -
 23
23 -
 24
24 -
 25
25 -
 26
26 -
 27
27 -
 28
28 -
 29
29 -
 30
30 -
 31
31 -
 32
32 -
 33
33 -
 34
34 -
 35
35 -
36
-
37
-
38
-
39
-
40
-
41
-
42
-
43
-
44
-
45
-
46
-
47
-
48
-
49
-
50
-
51
-
52
-
53
-
54
-
55
-
56
-
57
-
58
-
59
-
60
-
61
-
62
-
63
-
64
-
65
-
66
-
67
-
68
-
69
-
70
-
71
-
72
-
73
-
74
-
75
-
76
-
77
-
78
-
79
-
80
-
81
-
82
-
83
-
84
-
85
-
86
-
87
-
88
-
89
-
90
-
91
-
92
-
93
-
94
-
95
-
96
-
97
-
98
-
99
-
100
 |
 |

18
Company/Index
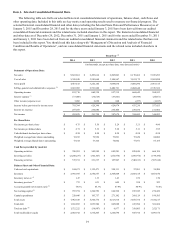
January 2,
2010
January 1,
2011
December
31, 2011
December 29,
2012
December 28,
2013
January 3,
2015
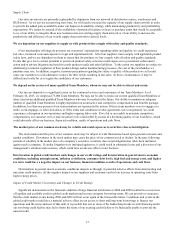
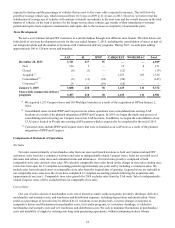
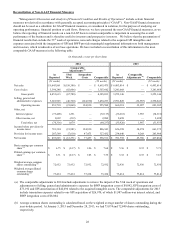
Advance Auto Parts $ 100.00 $ 164.14 $ 173.41 $ 178.69 $ 274.66 $ 396.20
S&P 500 Index 100.00 112.78 112.78 125.77 165.13 184.58
S&P Retail Index 100.00 123.66 127.26 155.56 227.23 249.51
Stock Price Performance
The following graph shows a comparison of the cumulative total return on our common stock, the Standard & Poor’s 500
Index and the Standard & Poor’s Retail Index. The graph assumes that the value of an investment in our common stock and in
each such index was $100 on January 2, 2010, and that any dividends have been reinvested. The comparison in the graph below
is based solely on historical data and is not intended to forecast the possible future performance of our common stock.
COMPARISON OF CUMULATIVE TOTAL RETURN AMONG
ADVANCE AUTO PARTS, INC., S&P 500 INDEX
AND S&P RETAIL INDEX