Advance Auto Parts 2014 Annual Report Download - page 89
Download and view the complete annual report
Please find page 89 of the 2014 Advance Auto Parts annual report below. You can navigate through the pages in the report by either clicking on the pages listed below, or by using the keyword search tool below to find specific information within the annual report.-
 1
1 -
2
-
3
-
4
-
5
-
6
-
7
-
8
-
9
-
10
-
11
-
12
-
13
-
14
-
15
-
16
-
17
-
18
-
19
-
20
-
21
-
22
-
23
-
24
-
25
-
26
-
27
-
28
-
29
-
30
-
31
-
32
-
33
-
34
-
35
-
36
-
37
-
38
-
39
-
40
-
41
-
42
-
43
-
44
-
45
-
46
-
47
-
48
-
49
-
50
-
51
-
52
-
53
-
54
-
55
-
56
-
57
-
58
-
59
-
60
-
61
-
62
-
63
-
64
-
65
-
66
-
67
-
68
-
69
-
70
-
71
-
72
-
73
-
74
-
75
-
76
-
77
-
78
-
 79
79 -
 80
80 -
 81
81 -
 82
82 -
 83
83 -
 84
84 -
 85
85 -
 86
86 -
 87
87 -
 88
88 -
 89
89 -
 90
90 -
 91
91 -
 92
92 -
 93
93 -
 94
94 -
 95
95 -
 96
96 -
 97
97 -
 98
98 -
 99
99 -
100
 |
 |

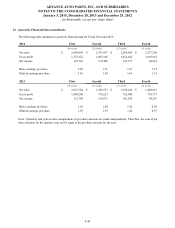
ADVANCE AUTO PARTS, INC. AND SUBSIDIARIES
NOTES TO THE CONSOLIDATED FINANCIAL STATEMENTS
January 3, 2015, December 28, 2013 and December 29, 2012
(in thousands, except per share data)
F-42
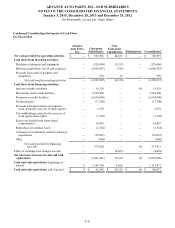
Condensed Consolidating Statements of Operations
For Fiscal 2014
Advance
Auto Parts,
Inc.
Guarantor
Subsidiaries
Non-
Guarantor
Subsidiaries Eliminations Consolidated
Net sales $ — $ 9,530,953 $ 527,595 $ (214,687) $ 9,843,861
Cost of sales, including purchasing and
warehousing costs — 5,231,421 373,514 (214,687) 5,390,248
Gross profit — 4,299,532 154,081 — 4,453,613
Selling, general and administrative
expenses 14,504 3,541,370 102,370 (56,341) 3,601,903
Operating (loss) income (14,504) 758,162 51,711 56,341 851,710
Other, net:
Interest expense (52,946) (20,334)(128)—
(73,408)
Other income (expense), net 67,470 (9,140) 1,103 (56,341) 3,092
Total other, net 14,524 (29,474) 975 (56,341)(70,316)
Income before provision for income taxes 20 728,688 52,686 — 781,394
Provision for income taxes 296 277,769 9,504 — 287,569
(Loss) income before equity in earnings of
subsidiaries (276) 450,919 43,182 — 493,825
Equity in earnings of subsidiaries 494,101 43,182 — (537,283)—
Net income $ 493,825 $ 494,101 $ 43,182 $ (537,283) $ 493,825
Condensed Consolidating Statements of Comprehensive Income
For Fiscal 2014
Advance
Auto Parts,
Inc.
Guarantor
Subsidiaries
Non-
Guarantor
Subsidiaries Eliminations Consolidated
Net income $ 493,825 $ 494,101 $ 43,182 $ (537,283) $ 493,825
Other comprehensive loss:
Changes in net unrecognized other
postretirement benefit costs — (752)— —
(752)
Currency translation — — (15,268)—
(15,268)
Equity in other comprehensive loss of
subsidiaries (16,020) (15,268) — 31,288 —
Other comprehensive loss (16,020) (16,020)(15,268) 31,288 (16,020)
Comprehensive income $ 477,805 $ 478,081 $ 27,914 $ (505,995) $ 477,805