Advance Auto Parts 2014 Annual Report Download - page 75
Download and view the complete annual report
Please find page 75 of the 2014 Advance Auto Parts annual report below. You can navigate through the pages in the report by either clicking on the pages listed below, or by using the keyword search tool below to find specific information within the annual report.-
 1
1 -
2
-
3
-
4
-
5
-
6
-
7
-
8
-
9
-
10
-
11
-
12
-
13
-
14
-
15
-
16
-
17
-
18
-
19
-
20
-
21
-
22
-
23
-
24
-
25
-
26
-
27
-
28
-
29
-
30
-
31
-
32
-
33
-
34
-
35
-
36
-
37
-
38
-
39
-
40
-
41
-
42
-
43
-
44
-
45
-
46
-
47
-
48
-
49
-
50
-
51
-
52
-
53
-
54
-
55
-
56
-
57
-
58
-
59
-
60
-
61
-
62
-
63
-
64
-
 65
65 -
 66
66 -
 67
67 -
 68
68 -
 69
69 -
 70
70 -
 71
71 -
 72
72 -
 73
73 -
 74
74 -
 75
75 -
 76
76 -
 77
77 -
 78
78 -
 79
79 -
 80
80 -
 81
81 -
 82
82 -
 83
83 -
 84
84 -
 85
85 -
86
-
87
-
88
-
89
-
90
-
91
-
92
-
93
-
94
-
95
-
96
-
97
-
98
-
99
-
100
 |
 |

ADVANCE AUTO PARTS, INC. AND SUBSIDIARIES
NOTES TO THE CONSOLIDATED FINANCIAL STATEMENTS
January 3, 2015, December 28, 2013 and December 29, 2012
(in thousands, except per share data)
F-28
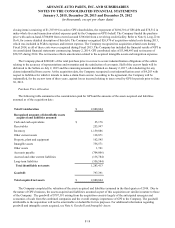
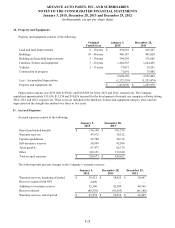
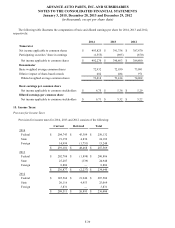
10. Property and Equipment:
Property and equipment consists of the following:
Original
Useful Lives
January 3,
2015
December 28,
2013
Land and land improvements 0 - 10 years $ 438,638 $ 418,207
Buildings 30 - 40 years 460,187 445,820
Building and leasehold improvements 3 - 30 years 394,259 336,685
Furniture, fixtures and equipment 3 - 20 years 1,402,563 1,244,456
Vehicles 2 - 13 years 37,051 18,291
Construction in progress 71,691 75,985
2,804,389 2,539,444
Less - Accumulated depreciation (1,372,359)(1,255,474)
Property and equipment, net $ 1,432,030 $ 1,283,970
Depreciation expense was $235,040, $199,821 and $185,909 for 2014, 2013 and 2012, respectively. The Company
capitalized approximately $11,436, $11,534 and $10,026 incurred for the development of internal use computer software during
2014, 2013 and 2012, respectively. These costs are included in the furniture, fixtures and equipment category above and are
depreciated on the straight-line method over three to five years.
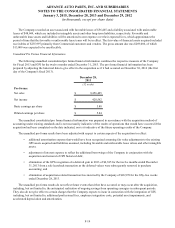
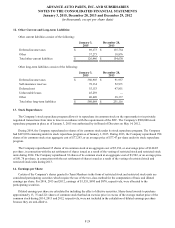
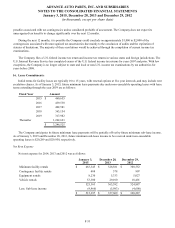
11. Accrued Expenses:
Accrued expenses consist of the following:
January 3,
2015
December 28,
2013
Payroll and related benefits $ 116,198 $ 101,576
Warranty reserves 47,972 39,512
Capital expenditures 29,780 20,714
Self-insurance reserves 58,899 45,504
Taxes payable 87,473 82,179
Other 180,351 139,140
Total accrued expenses $ 520,673 $ 428,625
The following table presents changes in the Company’s warranty reserves:
January 3,
2015
December 28,
2013
December 29,
2012
Warranty reserves, beginning of period $ 39,512 $ 38,425 $ 38,847
Reserves acquired with GPI 4,490 — —
Additions to warranty reserves 52,306 42,380 40,766
Reserves utilized (48,336)(41,293)(41,188)
Warranty reserves, end of period $ 47,972 $ 39,512 $ 38,425