Advance Auto Parts 2014 Annual Report Download - page 85
Download and view the complete annual report
Please find page 85 of the 2014 Advance Auto Parts annual report below. You can navigate through the pages in the report by either clicking on the pages listed below, or by using the keyword search tool below to find specific information within the annual report.-
 1
1 -
2
-
3
-
4
-
5
-
6
-
7
-
8
-
9
-
10
-
11
-
12
-
13
-
14
-
15
-
16
-
17
-
18
-
19
-
20
-
21
-
22
-
23
-
24
-
25
-
26
-
27
-
28
-
29
-
30
-
31
-
32
-
33
-
34
-
35
-
36
-
37
-
38
-
39
-
40
-
41
-
42
-
43
-
44
-
45
-
46
-
47
-
48
-
49
-
50
-
51
-
52
-
53
-
54
-
55
-
56
-
57
-
58
-
59
-
60
-
61
-
62
-
63
-
64
-
65
-
66
-
67
-
68
-
69
-
70
-
71
-
72
-
73
-
74
-
 75
75 -
 76
76 -
 77
77 -
 78
78 -
 79
79 -
 80
80 -
 81
81 -
 82
82 -
 83
83 -
 84
84 -
 85
85 -
 86
86 -
 87
87 -
 88
88 -
 89
89 -
 90
90 -
 91
91 -
 92
92 -
 93
93 -
 94
94 -
 95
95 -
96
-
97
-
98
-
99
-
100
 |
 |

ADVANCE AUTO PARTS, INC. AND SUBSIDIARIES
NOTES TO THE CONSOLIDATED FINANCIAL STATEMENTS
January 3, 2015, December 28, 2013 and December 29, 2012
(in thousands, except per share data)
F-38
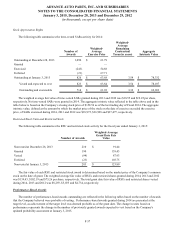
Compensation expense for performance-based awards of $6,161, $1,141, and $3,267 in 2014, 2013 and 2012, respectively,
was determined based on management’s estimate of the probable vesting outcome.
Performance-Based SARs
The following table summarizes the performance-based SARs activity for 2014:
Number of
Awards
Weighted-
Average
Exercise Price
Weighted-
Average
Remaining
Contractual
Term (in years)
Aggregate
Intrinsic Value
Outstanding at December 28, 2013 520 $ 78.21
Granted 303 141.57
Change in units based on performance (48) 90.57
Exercised (39) 35.18
Forfeited (107) 68.97
Outstanding at January 3, 2015 629 $ 112.01 5.47 $ 29,285
Vested and expected to vest 533 $ 108.17 4.97 $ 26,864
Outstanding and exercisable 92 $ 36.91 1.84 $ 11,152
The weighted average fair value of performance-based SARs granted during 2014, 2013 and 2012 was $32.41, $23.72 and
$19.23 per share, respectively. The aggregate intrinsic value of performance-based SARs exercised during 2014, 2013 and 2012
was $3,814, $14,257 and $34,020, respectively. As of January 3, 2015, the maximum potential payout under the Company’s
currently outstanding performance-based SAR awards was 2,167 units.
Performance-Based Restricted Stock Units
The following table summarizes the performance-based RSUs activity for 2014:
Number of Awards
Weighted-Average
Grant Date Fair Value
Nonvested at December 28, 2013 182 $ 75.36
Granted 19 123.32
Change in units based on performance 6 104.87
Vested (2) 74.43
Forfeited (10) 76.09
Nonvested at January 3, 2015 195 $ 81.98
The fair value of each performance-based RSU is determined based on the market price of the Company’s common stock
on the date of grant. The weighted average fair value of performance-based RSUs granted during 2014, 2013 and 2012 was
$123.32, $77.47 and $75.20 per share, respectively. The total grant date fair value of performance-based restricted stock vested
during 2014, 2013 and 2012 was $142, $1,290 and $4,858, respectively. As of January 3, 2015, the maximum potential payout
under the Company’s currently outstanding performance-based RSUs was 462 shares.