Advance Auto Parts 2014 Annual Report Download - page 70
Download and view the complete annual report
Please find page 70 of the 2014 Advance Auto Parts annual report below. You can navigate through the pages in the report by either clicking on the pages listed below, or by using the keyword search tool below to find specific information within the annual report.-
 1
1 -
2
-
3
-
4
-
5
-
6
-
7
-
8
-
9
-
10
-
11
-
12
-
13
-
14
-
15
-
16
-
17
-
18
-
19
-
20
-
21
-
22
-
23
-
24
-
25
-
26
-
27
-
28
-
29
-
30
-
31
-
32
-
33
-
34
-
35
-
36
-
37
-
38
-
39
-
40
-
41
-
42
-
43
-
44
-
45
-
46
-
47
-
48
-
49
-
50
-
51
-
52
-
53
-
54
-
55
-
56
-
57
-
58
-
59
-
 60
60 -
 61
61 -
 62
62 -
 63
63 -
 64
64 -
 65
65 -
 66
66 -
 67
67 -
 68
68 -
 69
69 -
 70
70 -
 71
71 -
 72
72 -
 73
73 -
 74
74 -
 75
75 -
 76
76 -
 77
77 -
 78
78 -
 79
79 -
 80
80 -
81
-
82
-
83
-
84
-
85
-
86
-
87
-
88
-
89
-
90
-
91
-
92
-
93
-
94
-
95
-
96
-
97
-
98
-
99
-
100
 |
 |
ADVANCE AUTO PARTS, INC. AND SUBSIDIARIES
NOTES TO THE CONSOLIDATED FINANCIAL STATEMENTS
January 3, 2015, December 28, 2013 and December 29, 2012
(in thousands, except per share data)
F-23
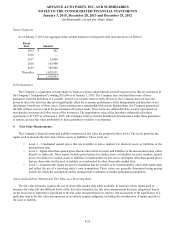
Amortization expense was $56,499, $7,974 and $3,635 for 2014, 2013 and 2012, respectively. The gross carrying amounts
and accumulated amortization of acquired intangible assets as of January 3, 2015 and December 28, 2013 are comprised of the
following:
January 3, 2015 December 28, 2013
Gross
Carrying
Amount
Accumulated
Amortization Net
Gross
Carrying
Amount
Accumulated
Amortization Net
Amortized intangible assets:
Customer relationships $ 362,483 $ (40,609) $ 321,874 $ 33,601 $ (10,309) $ 23,292
Acquired technology 8,850 (8,569) 281 8,850 (6,381) 2,469
Favorable leases 56,342 (11,939) 44,403 — — —
Non-compete and other 56,780 (14,596) 42,184 6,085 (2,524) 3,561
484,455 (75,713) 408,742 48,536 (19,214) 29,322
Unamortized intangible assets:
Brands, trademark and
tradenames 339,383 — 339,383 20,550 — 20,550
Total intangible assets $ 823,838 $ (75,713) $ 748,125 $ 69,086 $ (19,214) $ 49,872
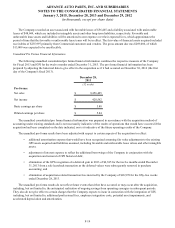
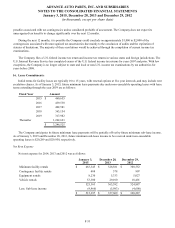
Future Amortization Expense
The table below shows expected amortization expense for the next five years for acquired intangible assets recorded as of
January 3, 2015:
Fiscal Year Amount
2015 $ 52,115
2016 48,312
2017 45,959
2018 42,948
2019 32,187
Thereafter 187,221
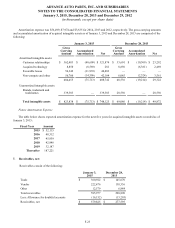
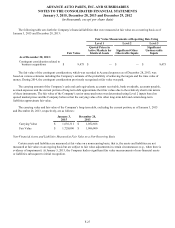
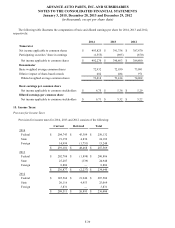
7. Receivables, net:
Receivables consist of the following:
January 3,
2015
December 28,
2013
Trade $ 360,922 $ 145,670
Vendor 222,476 138,336
Other 12,579 6,884
Total receivables 595,977 290,890
Less: Allowance for doubtful accounts (16,152)(13,295)
Receivables, net $ 579,825 $ 277,595