Advance Auto Parts 2014 Annual Report Download - page 88
Download and view the complete annual report
Please find page 88 of the 2014 Advance Auto Parts annual report below. You can navigate through the pages in the report by either clicking on the pages listed below, or by using the keyword search tool below to find specific information within the annual report.-
 1
1 -
2
-
3
-
4
-
5
-
6
-
7
-
8
-
9
-
10
-
11
-
12
-
13
-
14
-
15
-
16
-
17
-
18
-
19
-
20
-
21
-
22
-
23
-
24
-
25
-
26
-
27
-
28
-
29
-
30
-
31
-
32
-
33
-
34
-
35
-
36
-
37
-
38
-
39
-
40
-
41
-
42
-
43
-
44
-
45
-
46
-
47
-
48
-
49
-
50
-
51
-
52
-
53
-
54
-
55
-
56
-
57
-
58
-
59
-
60
-
61
-
62
-
63
-
64
-
65
-
66
-
67
-
68
-
69
-
70
-
71
-
72
-
73
-
74
-
75
-
76
-
77
-
 78
78 -
 79
79 -
 80
80 -
 81
81 -
 82
82 -
 83
83 -
 84
84 -
 85
85 -
 86
86 -
 87
87 -
 88
88 -
 89
89 -
 90
90 -
 91
91 -
 92
92 -
 93
93 -
 94
94 -
 95
95 -
 96
96 -
 97
97 -
 98
98 -
99
-
100
 |
 |

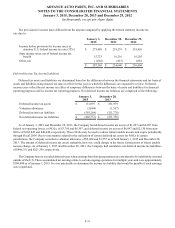
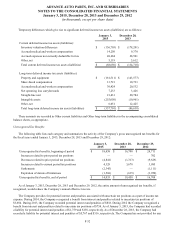
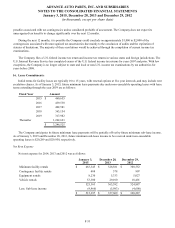
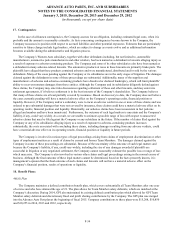
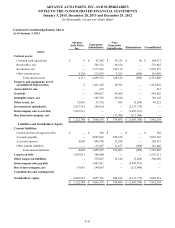
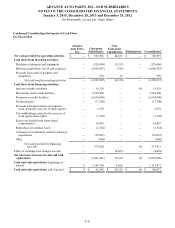
ADVANCE AUTO PARTS, INC. AND SUBSIDIARIES
NOTES TO THE CONSOLIDATED FINANCIAL STATEMENTS
January 3, 2015, December 28, 2013 and December 29, 2012
(in thousands, except per share data)
F-41
Condensed Consolidating Balance Sheets
As of January 3, 2015
Advance
Auto Parts,
Inc.
Guarantor
Subsidiaries
Non-
Guarantor
Subsidiaries Eliminations Consolidated
Assets
Current assets:
Cash and cash equivalents $ 9 $ 65,345 $ 39,326 $ (9) $ 104,671
Receivables, net — 549,151 30,674 — 579,825
Inventories, net — 3,771,816 165,139 — 3,936,955
Other current assets 4,102 113,003 3,383 (899) 119,589
Total current assets 4,111 4,499,315 238,522 (908) 4,741,040
Property and equipment, net of
accumulated depreciation 2 1,421,325 10,703 — 1,432,030
Assets held for sale — 615 — — 615
Goodwill — 940,817 54,609 — 995,426
Intangible assets, net — 689,745 58,380 — 748,125
Other assets, net 12,963 36,762 683 (5,286) 45,122
Investment in subsidiaries 2,057,761 280,014 — (2,337,775)—
Intercompany note receivable 1,047,911 — — (1,047,911)—
Due from intercompany, net — — 211,908 (211,908)—
$ 3,122,748 $ 7,868,593 $ 574,805 $ (3,603,788) $ 7,962,358
Liabilities and Stockholders' Equity
Current liabilities:
Current portion of long-term debt $ — $ 582 $ — $ — $ 582
Accounts payable — 2,845,043 250,322 — 3,095,365
Accrued expenses 4,884 498,505 17,284 — 520,673
Other current liabilities — 115,497 11,857 (908) 126,446
Total current liabilities 4,884 3,459,627 279,463 (908) 3,743,066
Long-term debt 1,047,911 588,400 — — 1,636,311
Other long-term liabilities — 570,027 15,328 (5,286) 580,069
Intercompany note payable — 1,047,911 — (1,047,911)—
Due to intercompany, net 67,041 144,867 — (211,908)—
Commitments and contingencies
Stockholders' equity 2,002,912 2,057,761 280,014 (2,337,775) 2,002,912
$ 3,122,748 $ 7,868,593 $ 574,805 $ (3,603,788) $ 7,962,358